
Industry News
Curation by industry experts
Hot Articles
Popular Tags
Green Manufacturing Technology Costs: Upfront Investment and Payback
For business leaders, green manufacturing technology cost is more than an upfront capital expense—it is a long-term investment in operational efficiency and resilience.
Energy-efficient drives, optimized transmission systems, and smarter production controls can reduce energy use and maintenance needs, but their financial returns depend on equipment selection, operating conditions, and implementation costs.
This article examines the key investment factors and payback considerations to help decision-makers evaluate opportunities and build a stronger business case for sustainable manufacturing.
How Much Does Green Manufacturing Technology Cost?
There is no reliable universal price for a green manufacturing upgrade. Costs depend on equipment capacity, existing infrastructure, operating hours, installation complexity, and local labor rates.
A targeted motor or belt replacement may require a relatively modest investment, while a production-line modernization can involve substantial engineering, control-system integration, and planned downtime.
The financial question is not simply whether an efficient component costs more. It is whether the additional investment produces sufficient, dependable benefits over its useful life.
Start by comparing the proposed solution with a realistic alternative: maintaining existing equipment, replacing it with standard equipment, or upgrading an entire system.
For an asset approaching failure, compare the incremental cost of the efficient option against the standard replacement, rather than treating the full purchase price as incremental.
For equipment that could continue operating, include the full upgrade cost and account for the remaining value and expected maintenance needs of the existing asset.
Projects operating for long hours under variable loads often deserve early attention, but a promising application still needs site-specific measurements and a documented financial case.
What Should Be Included in the Upfront Investment?
The equipment quotation is only one part of the investment. A credible budget includes the work required to install, connect, commission, and support the technology.
Underestimating these costs can turn an attractive supplier payback estimate into a disappointing project. Build the budget jointly with engineering, operations, maintenance, finance, and procurement.
Equipment and System Components
Include the purchase price of motors, variable frequency drives, gear reducers, belts, seals, sensors, controls, and any supporting components required by the selected design.
Record whether the quote covers enclosures, electrical protection, cabling, filters, software licenses, and spare parts. These items can materially change the installed price.
For comparative analysis, separate the base-case expenditure from the additional investment needed to achieve the efficiency improvement. Avoid assigning unrelated replacement costs to the green upgrade.
Engineering, Installation, and Downtime
Allow for site surveys, system design, mechanical modifications, electrical work, control programming, commissioning, and safety validation. Existing equipment may require adapters or structural changes.
Production interruption is a real economic cost when lost output cannot be recovered. Coordinate installation with a planned shutdown, but still budget for scheduling and execution risks.
Include operator training, maintenance procedures, condition-monitoring integration, and any recurring software or service fees. These expenses affect both adoption and long-term returns.
Set a contingency proportionate to uncertainty, particularly when equipment condition, electrical capacity, or control-system compatibility cannot be confirmed before detailed engineering.
Which Technologies Offer the Strongest Business Case?
The best opportunities depend on the process, not on the technology label. Prioritize systems with significant energy consumption, avoidable losses, frequent failures, or expensive interruptions.
Efficient Motors and Variable Frequency Drives
High-efficiency motors can lower electrical losses, especially on equipment with substantial annual operating hours. Savings depend on motor loading, operating profile, and the efficiency difference.
Variable frequency drives adjust motor speed to process demand. They can be particularly effective on suitable variable-torque pumps and fans with extended periods below full output.
Not every application benefits equally. Constant-speed duties, unsuitable motor insulation, harmonic requirements, cooling limitations, and minimum process speeds can reduce savings or increase implementation costs.
Assess the complete driven system, including controls and mechanical transmission, before purchasing. An efficient motor cannot compensate fully for unnecessary throttling, poor alignment, or excessive mechanical losses.
Power Transmission and Mechanical Components
Gear reducers, belts, couplings, bearings, and mechanical seals influence energy use and reliability. Their value depends on sizing, lubrication, alignment, operating conditions, and maintenance practice.
A properly specified synchronous belt can reduce slip and eliminate belt lubrication in suitable applications. However, replacement economics depend on pulley changes, load characteristics, and installation requirements.
Efficient gear reducers may lower losses, but compare efficiency at the actual load and speed. Oversizing, incorrect lubricant selection, and poor alignment can erode expected benefits.
For mechanical seals, evaluate leakage, product loss, flush requirements, environmental exposure, and failure consequences. A higher purchase price may be justified by longer service intervals.
Avoid treating component efficiency figures as system-wide savings. Measure input power and process output, and confirm that changes do not compromise throughput, product quality, or safety.
Controls, Monitoring, and Process Optimization
Production controls and energy monitoring can identify idle loads, compressed-air leaks, abnormal equipment behavior, and scheduling opportunities. Their value depends on acting on the information.
Predictive maintenance may reduce unplanned stoppages when failure modes are detectable and maintenance teams can respond. Sensor installation alone does not guarantee fewer failures.
Include data connectivity, cybersecurity review, software subscriptions, integration, and staff time in the business case. Define who owns alerts and what operational response they trigger.
How Do You Calculate Payback and Total Return?
Simple payback is a useful first screen: divide the incremental upfront investment by the expected annual net cash benefit from the proposed upgrade.
Annual net cash benefit can include avoided energy costs, maintenance savings, and other defensible operating benefits, minus additional annual service fees and operating expenses.
For example, assume an upgrade costs $120,000 more than the baseline option and reduces electricity consumption by 300,000 kilowatt-hours per year at $0.12 per kilowatt-hour.
The annual electricity saving is $36,000. If recurring maintenance savings are $8,000 and additional service costs are $4,000, annual net benefit is $40,000.
Simple payback is therefore three years: $120,000 divided by $40,000. This illustration assumes savings begin immediately and remain constant; actual results will vary.
The example excludes taxes, financing, incentives, changes in production, and residual value. It also assumes the electricity rate represents the actual avoidable cost per kilowatt-hour.
Do not automatically multiply energy savings by an all-in utility rate. Demand charges, time-of-use pricing, fixed fees, and export arrangements can change the value of savings.
Simple payback ignores the timing of cash flows after the payback point. For major investments, also calculate net present value over the relevant project life.
Use the company’s approved discount rate, expected replacement and maintenance schedules, taxes where relevant, and a consistent treatment of inflation and energy prices.
Internal rate of return can support comparison with other capital projects, but it should not replace net present value when project scale or timing differs materially.
Assess incentives only after confirming eligibility, application deadlines, compliance obligations, and whether funding is guaranteed. Avoid counting the same incentive twice in project cash flows.
How Should You Value Reliability and Production Benefits?
Energy savings are often measurable, but avoided downtime may be more valuable. Quantify reliability benefits using historical failure frequency, repair duration, and the actual cost of interruption.
Use contribution margin on genuinely lost production, not sales revenue, when estimating financial impact. Exclude output that can be recovered without meaningful additional cost.
For maintenance, include labor, replacement components, consumables, and external services only where the upgrade is expected to change those costs. Document assumptions with maintenance personnel.
Separate recurring savings from one-time avoided repairs. If an upgrade merely delays a future overhaul, model the timing difference instead of counting the whole overhaul as eliminated.
Some benefits, such as improved safety, regulatory readiness, or customer confidence, may be strategically important but difficult to monetize. Present them separately from calculated cash savings.
Where estimates are uncertain, show a conservative case without reliability benefits and a second case with justified benefits. This makes the investment decision easier to defend.
What Risks Can Extend the Payback Period?
Actual returns can fall short when projects rely on nameplate ratings instead of measured loads, assume unrealistic operating hours, or overlook changes in production demand.
Integration risks also matter. A new drive may require electrical upgrades, while a transmission retrofit may create alignment challenges or require components unavailable during a shutdown.
Supplier claims deserve scrutiny: request the operating conditions, baseline assumptions, expected maintenance requirements, warranty terms, and evidence supporting projected energy or reliability improvements.
Rebound effects can occur when capacity improvements lead to higher production. Track energy per unit of output as well as total energy consumption to interpret results.
Build a sensitivity analysis around the variables that matter most: operating hours, energy prices, realized savings, installation costs, downtime, and equipment service life.
For example, test whether the project remains acceptable if annual savings are lower than expected or installation costs rise. State the threshold that would change the decision.
Check technology compatibility, spare-parts availability, service coverage, and cybersecurity responsibilities before approval. Assign clear ownership for commissioning, performance verification, and corrective action.
How Can Decision-Makers Build a Practical Investment Plan?
Begin with an asset-level baseline covering energy use, operating hours, production output, maintenance history, failures, and planned replacement dates. Use measured data wherever practical.
Screen opportunities by expected value, technical feasibility, operational risk, and strategic importance. Give particular attention to equipment that is heavily used or already due for replacement.
Develop comparable scenarios for each shortlisted project. Include the baseline alternative, installed cost, annual cash flows, expected life, implementation schedule, and key assumptions.
When uncertainty is high, run a controlled pilot on a representative asset. Agree on measurement boundaries, test duration, operating conditions, and acceptance criteria before installation.
Normalize results for relevant changes such as production volume, operating hours, and weather where applicable. A consistent baseline helps distinguish project savings from unrelated changes.
After commissioning, compare actual performance with the approved case. Investigate gaps, correct settings or maintenance issues, and use verified results to improve future investment decisions.
For a portfolio of projects, avoid double counting shared savings. For example, recalculate motor savings if an earlier process change has already reduced the motor’s load.
Making the Investment Decision
Green manufacturing technology cost should be judged against a credible baseline and the cash flows the business can reasonably expect, not against equipment price alone.
The strongest projects combine suitable operating conditions, verified system-level savings, manageable implementation risk, and benefits that remain attractive under conservative assumptions.
By comparing alternatives, testing sensitivities, and measuring results after installation, decision-makers can direct capital toward improvements that strengthen both operational performance and environmental outcomes.
Recommended News
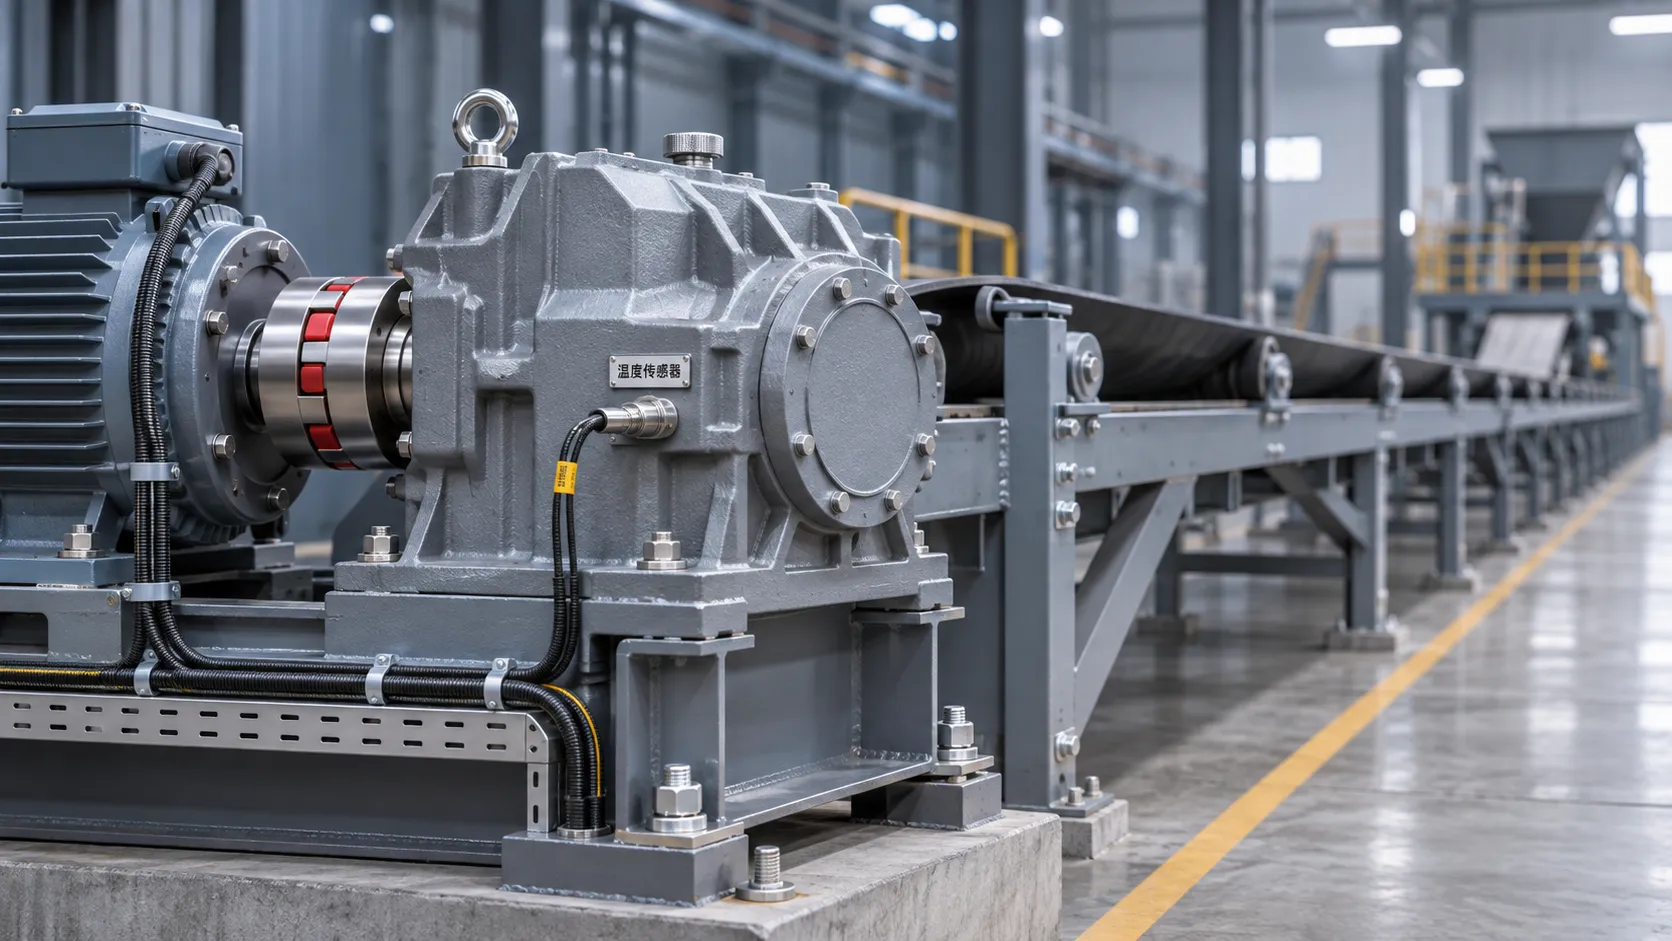
Smart Transmission Components: What Drives Price and Total Cost?
Smart transmission components price is just the start. Explore the factors behind quotes and total ownership costs to compare suppliers and buy with confidence.
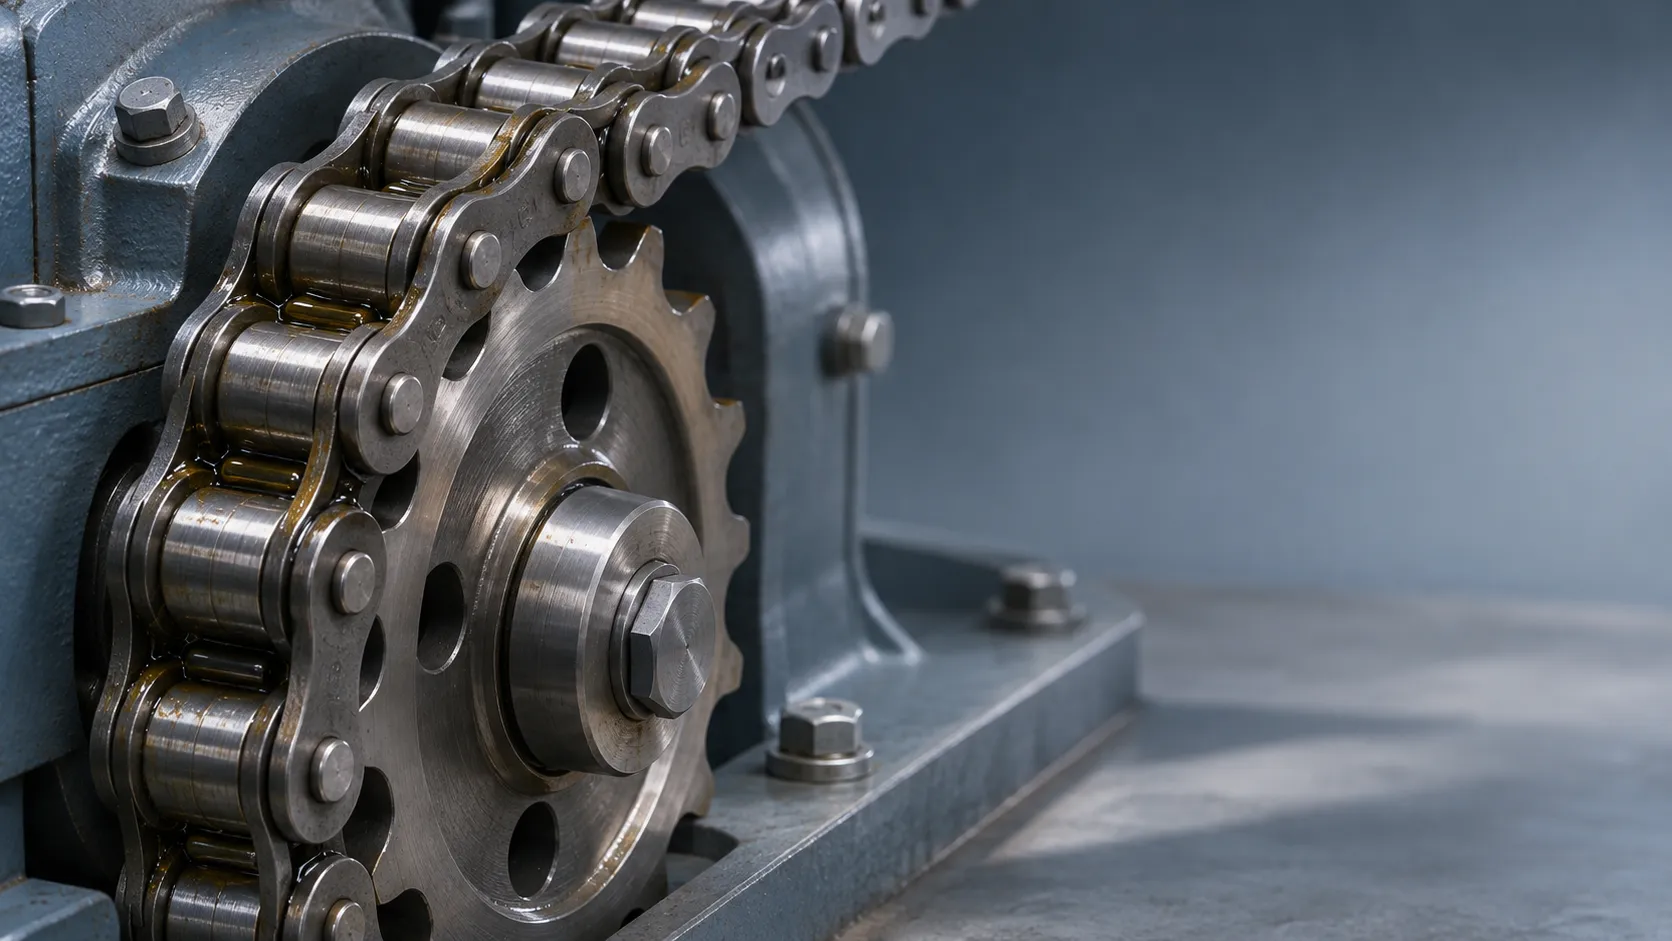
Choosing Long-Life Roller Chains for High-Load Applications
Discover how to choose long-life roller chains for high-load drives, from fatigue ratings and lubrication to sprocket alignment and operating costs.
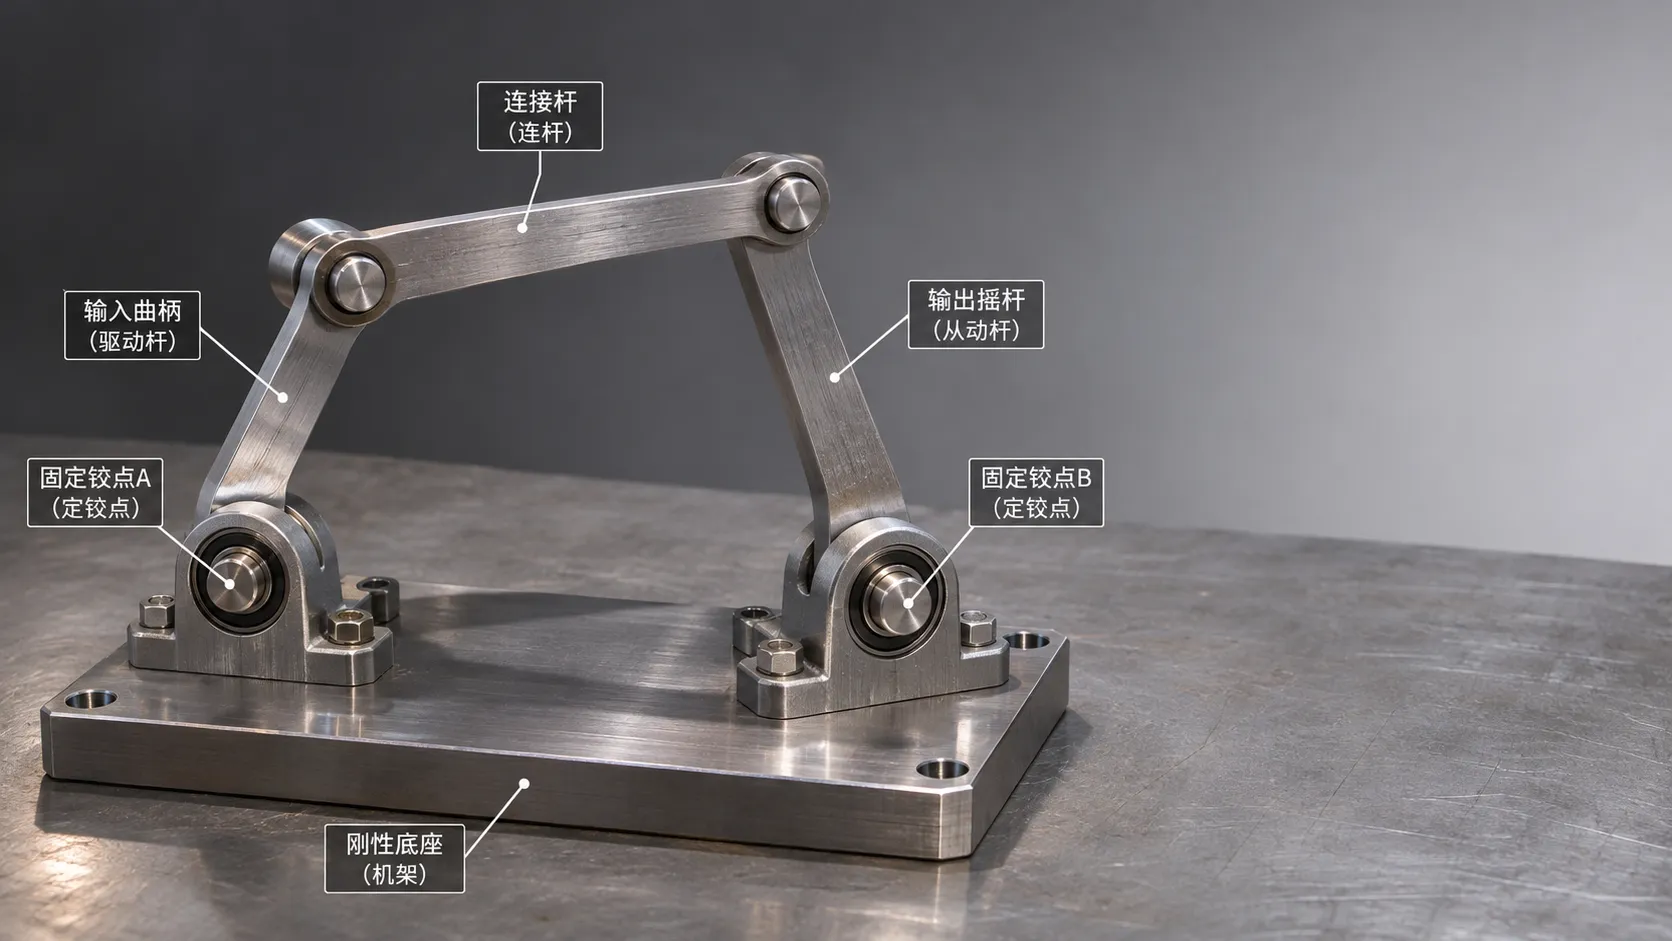
Mechanical Linkage Assemblies: How Motion and Force Are Transmitted
Explore mechanical linkage technology assemblies and learn how geometry, joints, and load affect motion, force, accuracy, and reliability.
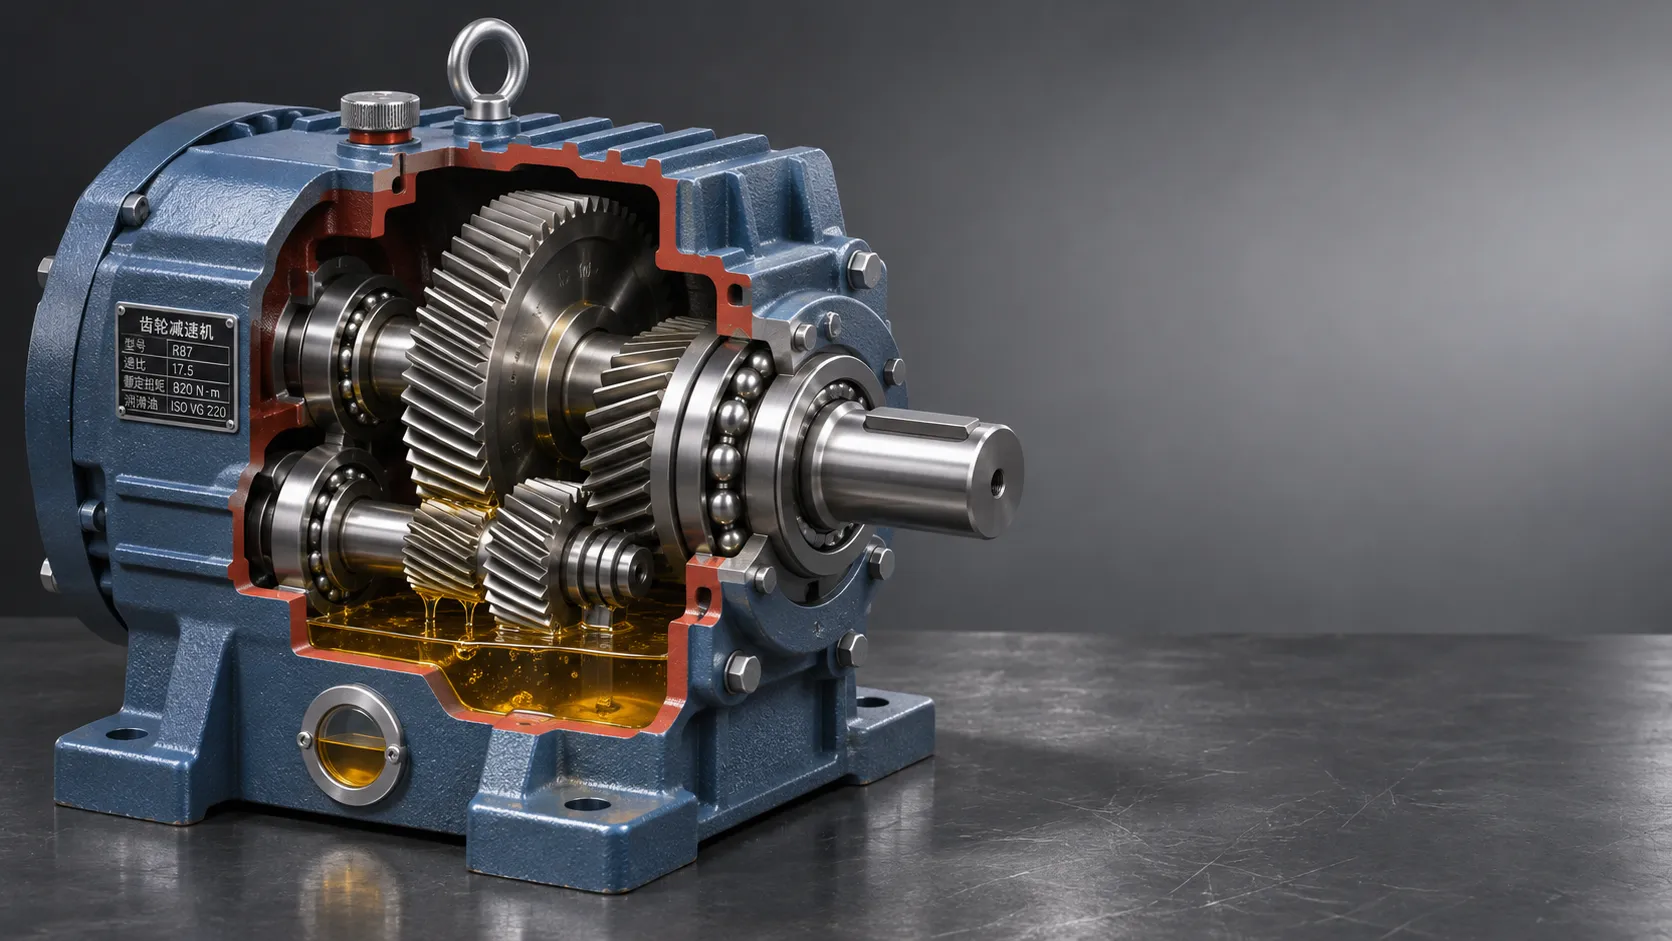
Choosing Wear-Resistant Industrial Transmissions for Long Service Life
Choose wear resistant long life transmissions with confidence. Explore load, lubrication, sealing and supplier checks to reduce downtime and service costs.
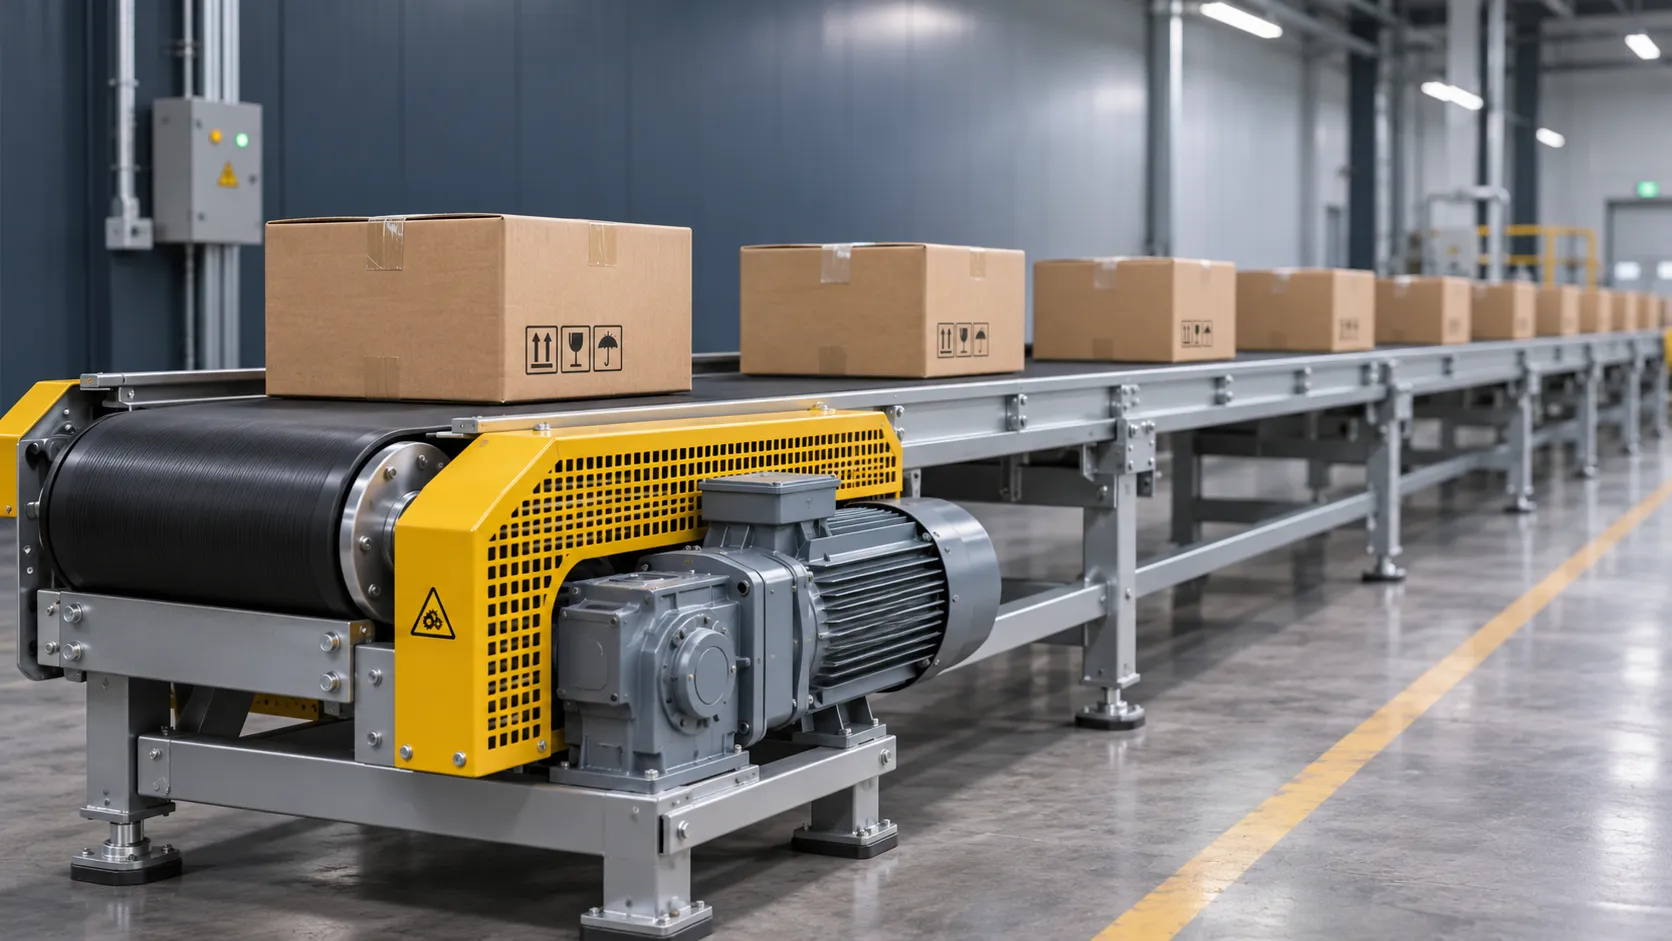
Choosing Industrial Motion Solutions for Conveyor Speed and Load Requirements
Explore industrial motion solutions for conveyor speed and load requirements. Compare drives, torque, control and duty cycles to make a confident choice.
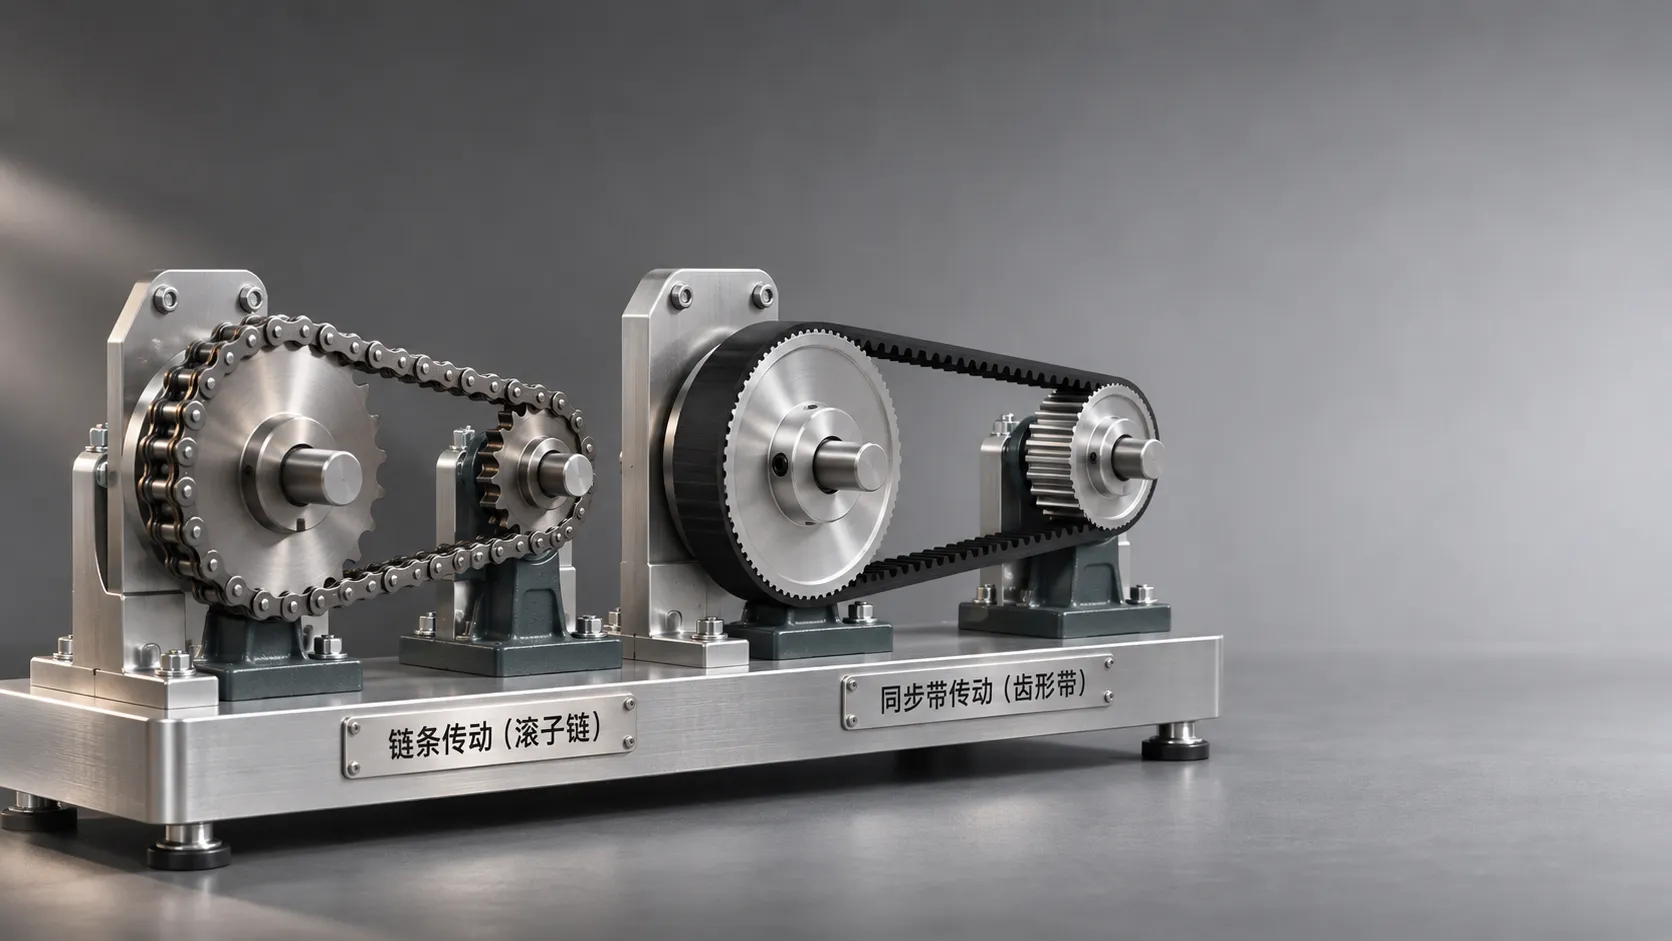
Chain vs. Belt Drives: How to Choose for Load, Speed, and Maintenance
Explore our industrial component knowledge base for drive selection. Compare chain and belt drives by load, speed, and maintenance to find the right fit.
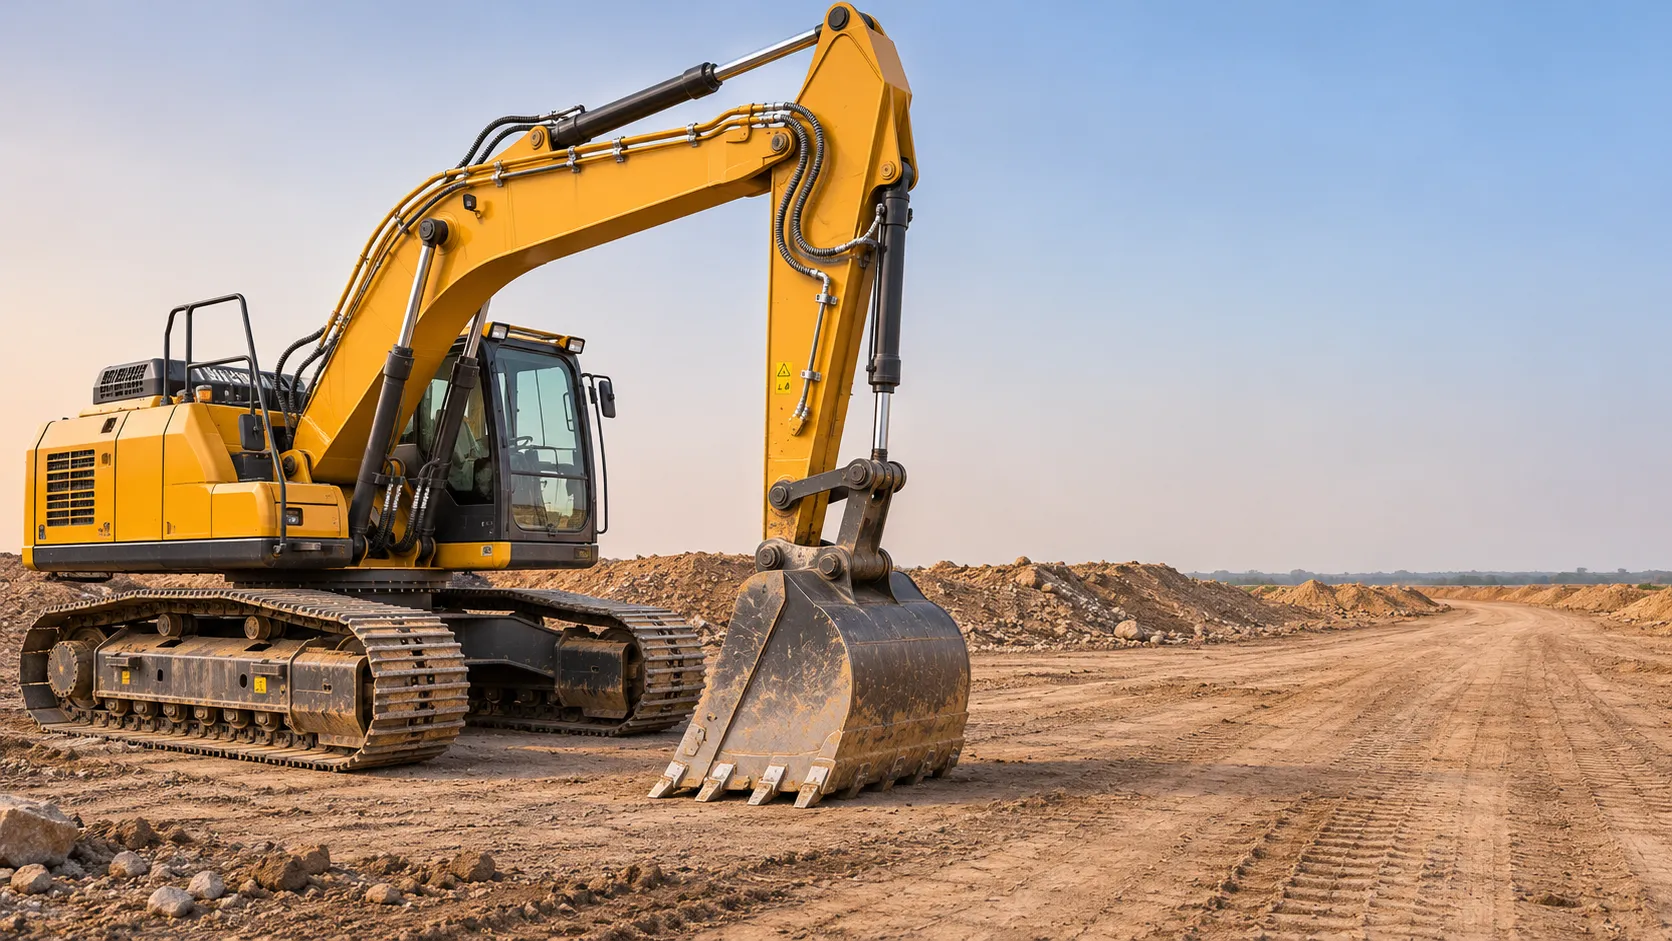
Choosing Heavy Equipment for Construction: Capacity, Terrain and Costs
Choose heavy duty heavy equipment with confidence. Compare capacity, terrain, productivity, and total costs to find the right machine for your construction project.
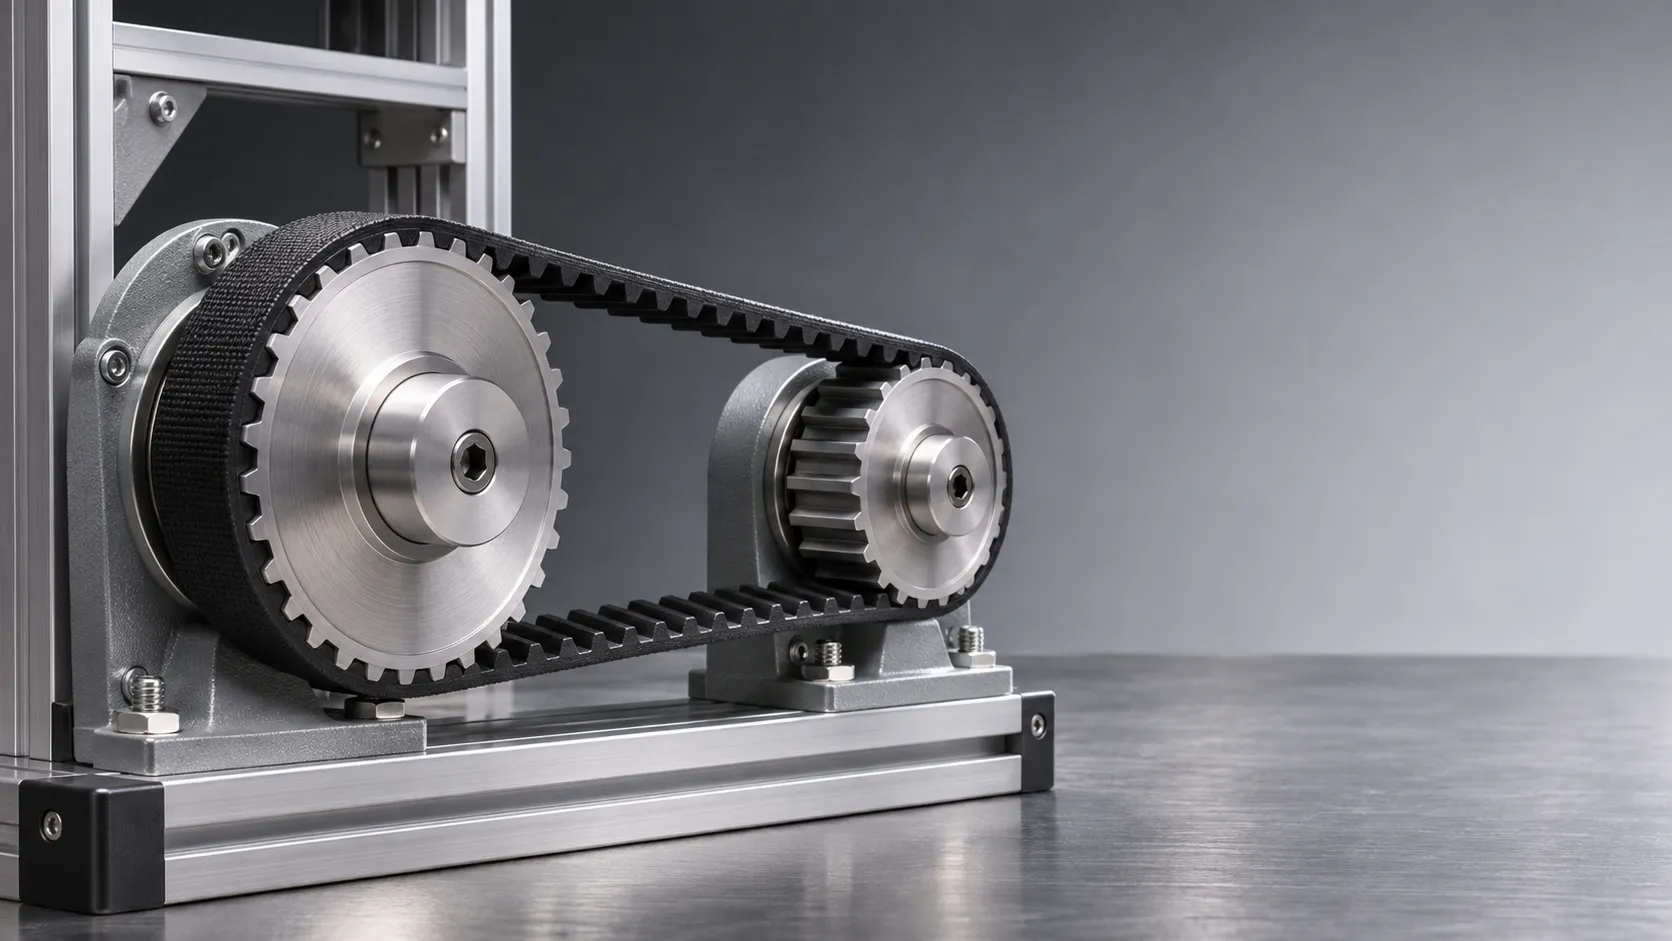
Choosing Long-Life Timing Belts: Load, Speed and Operating Conditions
Choose long-life timing belts with confidence. Compare load, speed, environment and maintenance factors to improve reliability and reduce downtime.
Choosing Elastomers for Critical Seals: Media and Temperature Compatibility
Critical sealing solutions: elastomer selection starts with media and temperature compatibility. Discover how to compare compounds and prevent seal failure.