
Industry News
Curation by industry experts
Hot Articles
Popular Tags
What tribology analysis reveals about machine wear early
What if machine wear could be detected before failure interrupts production? For operators and maintenance teams, tribology analysis for mechanical systems offers an early warning by revealing friction, lubrication issues, and surface damage long before major breakdowns occur. Understanding these signals helps improve reliability, reduce unplanned downtime, and support smarter decisions in daily equipment operation.
In power transmission, motion control, and sealing applications, early wear signals are rarely random. They usually begin as small changes in contact surfaces, lubricant condition, vibration response, or temperature behavior. For operators responsible for daily uptime, recognizing those changes 2 to 8 weeks earlier can make the difference between a planned service stop and an unplanned line outage.
This is why tribology analysis for mechanical systems is becoming more relevant across conveyors, gear drives, reducers, couplings, bearings, pumps, and mechanical seals. It gives frontline teams a practical way to connect lubricant health, friction behavior, and wear debris patterns with real machine condition, especially in high-load or continuous-duty environments.
Why tribology analysis detects wear before failure
Most failures do not start with a dramatic breakdown. They start with a shift in lubrication film thickness, rising surface roughness, contaminant entry, or metal-to-metal contact. In many industrial systems, these changes appear days or weeks before operators hear abnormal noise or see obvious temperature alarms.
Tribology analysis for mechanical systems focuses on three linked factors: friction, wear, and lubrication. When these factors are monitored together, they reveal whether a machine is running in a stable regime, a mixed-lubrication regime, or a boundary-contact condition where accelerated damage is more likely.
What operators can see in the early stage
Early wear often shows up as fine metallic particles in oil, discoloration of grease, rising seal lip temperature, or repeated need for relubrication. In a gearbox, for example, a 5°C to 10°C increase above normal running temperature may be the first practical sign that friction losses are increasing.
In belt drives and couplings, poor alignment can produce uneven contact, edge wear, and more heat at specific points. In rolling bearings, a small amount of abrasive contamination can shorten lubricant life by 30% to 50% under dusty or wet operating conditions, even before the bearing becomes noisy.
Typical wear mechanisms found early
- Adhesive wear caused by insufficient lubricant film
- Abrasive wear caused by dust, hard particles, or poor filtration
- Corrosive wear linked to moisture, chemical attack, or degraded oil
- Fatigue wear developing under cyclic load and repeated surface stress
The table below shows how common tribological signals can be linked to likely machine issues in everyday industrial operation.
The key point is that these signals are actionable before catastrophic damage occurs. Operators do not need to wait for a severe vibration alarm or a seized shaft. A disciplined review of lubricant, surfaces, and contact behavior often provides an earlier warning window.
Where tribology analysis matters most in mechanical systems
Not every component wears in the same way. Tribology analysis for mechanical systems is most valuable where there is rolling, sliding, sealing, or repeated contact under load. In general industrial plants, that includes reducers, bearings, chains, couplings, guide rails, pump assemblies, and sealing interfaces.
Gearboxes and reducers
In gear systems, tribology helps identify micropitting, scuffing, lubricant starvation, and contamination. A reducer operating 16 to 20 hours per day under fluctuating torque is especially sensitive to oil cleanliness and viscosity stability. Even a modest shift in particle count or oil film performance can signal rising wear risk.
Bearings and rolling elements
Bearings often fail because contamination, over-greasing, under-greasing, or misalignment changes the contact condition. Tribological review supports maintenance teams by showing whether wear is fatigue-driven, abrasion-driven, or linked to lubrication breakdown. This helps avoid replacing a bearing without correcting the actual root cause.
Mechanical seals and sliding interfaces
For pumps, mixers, and rotating equipment, seal faces depend on a stable lubricating film. Dry running for even a short interval, such as 30 to 90 seconds in some conditions, can create enough heat to damage seal surfaces. Tribology analysis helps teams judge whether leakage is caused by wear, thermal distortion, contamination, or incompatible lubrication practice.
Belts, chains, and couplings
Power transmission components also benefit from tribology-based thinking. Although belts are not oil-lubricated in the same way as gears, friction coefficient, surface condition, dust loading, and pulley alignment still influence wear rate. Chains and couplings show similar patterns where poor lubrication or angular misalignment can multiply contact stress.
The following comparison helps operators prioritize where to apply inspection and analysis effort first.
A practical lesson from this comparison is simple: the more continuous the duty cycle and the harsher the environment, the shorter the review interval should be. A clean indoor packaging line and a dusty bulk-material conveyor should not follow the same inspection rhythm.
How operators can apply tribology analysis in daily maintenance
For many plants, the best starting point is not a complex laboratory program. It is a repeatable field routine that combines visual checks, temperature trend observation, lubrication control, and scheduled sample review. Tribology analysis for mechanical systems becomes useful when it is tied to operating history and action thresholds.
A 5-step implementation routine
- Select 5 to 10 critical assets with the highest downtime cost or safety impact.
- Record baseline temperature, noise, lubricant type, load condition, and relubrication interval.
- Inspect samples or surfaces at fixed intervals, such as every 2 weeks or every 500 hours.
- Set action levels for particle increase, leakage, heat rise, or lubricant discoloration.
- Link findings to corrective actions such as alignment, filtration, lubricant change, or seal replacement.
What to monitor during routine checks
Operators should focus on a short list of consistent indicators rather than too many isolated readings. A stable checklist improves trend quality over time and reduces false alarms caused by one-off observations.
- Temperature deviation from baseline, for example above 5°C
- Change in lubricant color, odor, or texture
- Visible leakage or dust ingress around seals and housings
- Presence of metallic sheen or solid particles in drain samples
- Repeated increase in energy use or current draw under the same load
- Surface marks, scoring, or polishing on accessible contact parts
Common mistakes to avoid
One common mistake is changing lubricant grade without reviewing speed, load, and temperature range. Another is treating leakage only as a seal problem when shaft finish, alignment, or contamination may be the real cause. A third mistake is taking samples irregularly, which makes trend comparison unreliable.
Plants also lose value when tribology findings stay inside maintenance records and never reach production teams. If operators know that a conveyor reducer has entered a higher wear stage, they can reduce shock loading, avoid overload starts, and schedule service more intelligently over the next 7 to 14 days.
How tribology supports smarter maintenance decisions and sourcing
Early wear detection is not only a maintenance issue. It also improves how plants choose lubricants, seals, bearings, and transmission components. When tribological evidence shows why a part failed, buyers and operators can specify better-fit replacements instead of repeating the same mismatch.
Better replacement decisions
If abrasive wear appears repeatedly, the best response may be stronger sealing, better filtration, or a surface material upgrade. If heat-driven oxidation is the main pattern, the answer may be a higher-stability lubricant or a review of duty cycle. These choices can extend service intervals from 3 months to 6 months or longer in some applications.
Questions operators should raise with suppliers
- What load and speed range is the component designed for?
- What shaft finish, alignment tolerance, or mounting condition is recommended?
- Which lubricant type and relubrication interval are suitable for the duty cycle?
- How does the product perform in dust, moisture, washdown, or high-temperature areas?
- What wear signs indicate the part should be replaced before failure?
Why industry intelligence matters
For teams working across multiple mechanical systems, technical intelligence is increasingly important. Platforms such as GPT-Matrix help connect material behavior, lubrication challenges, and transmission reliability trends into practical decision support. That is especially useful when plants compare longer-life components, lower-maintenance sealing options, or energy-saving power transmission upgrades.
When operators understand what tribology analysis for mechanical systems is showing, they can communicate more clearly with maintenance engineers, planners, and procurement staff. That reduces repeat failure cycles, shortens diagnosis time, and supports more consistent equipment availability across production lines.
Practical FAQ for frontline teams
How often should tribology checks be done?
For critical assets, a 2-week to 4-week interval is common in continuous-duty service. For lower-risk machines, monthly or every 1,000 operating hours may be enough. The right frequency depends on load, contamination level, speed, temperature, and downtime cost.
Does tribology replace vibration monitoring?
No. The two approaches are complementary. Vibration monitoring often detects dynamic mechanical change, while tribology reveals contact, lubrication, and wear conditions. Using both provides a broader condition picture, especially for bearings, gears, and sealed rotating equipment.
Is laboratory analysis always necessary?
Not always. Visual inspection, trend logging, and routine sample checks can already deliver value. Laboratory support becomes more useful when failure modes are unclear, contamination sources must be identified, or high-value assets justify deeper analysis.
What is the first sign operators should never ignore?
A repeatable change from baseline is the most important warning sign. That may be a temperature rise of 5°C or more, new leakage, faster grease darkening, or visible fine metallic residue. One abnormal reading may not confirm a problem, but a trend over 2 or 3 checks deserves action.
Machine wear rarely appears without warning. The warning is often hidden in friction behavior, lubricant condition, and surface damage long before failure becomes obvious. By using tribology analysis for mechanical systems in a structured way, operators can detect wear earlier, plan interventions better, and reduce avoidable downtime across gear drives, bearings, seals, and other critical transmission assets.
For organizations that want stronger reliability decisions backed by deeper industrial intelligence, GPT-Matrix offers a useful bridge between material science, mechanical transmission logic, and practical operating needs. To explore component selection, maintenance strategy, or trend-based reliability improvement, contact us today, request a tailored solution, or learn more about the right approach for your mechanical systems.
Recommended News
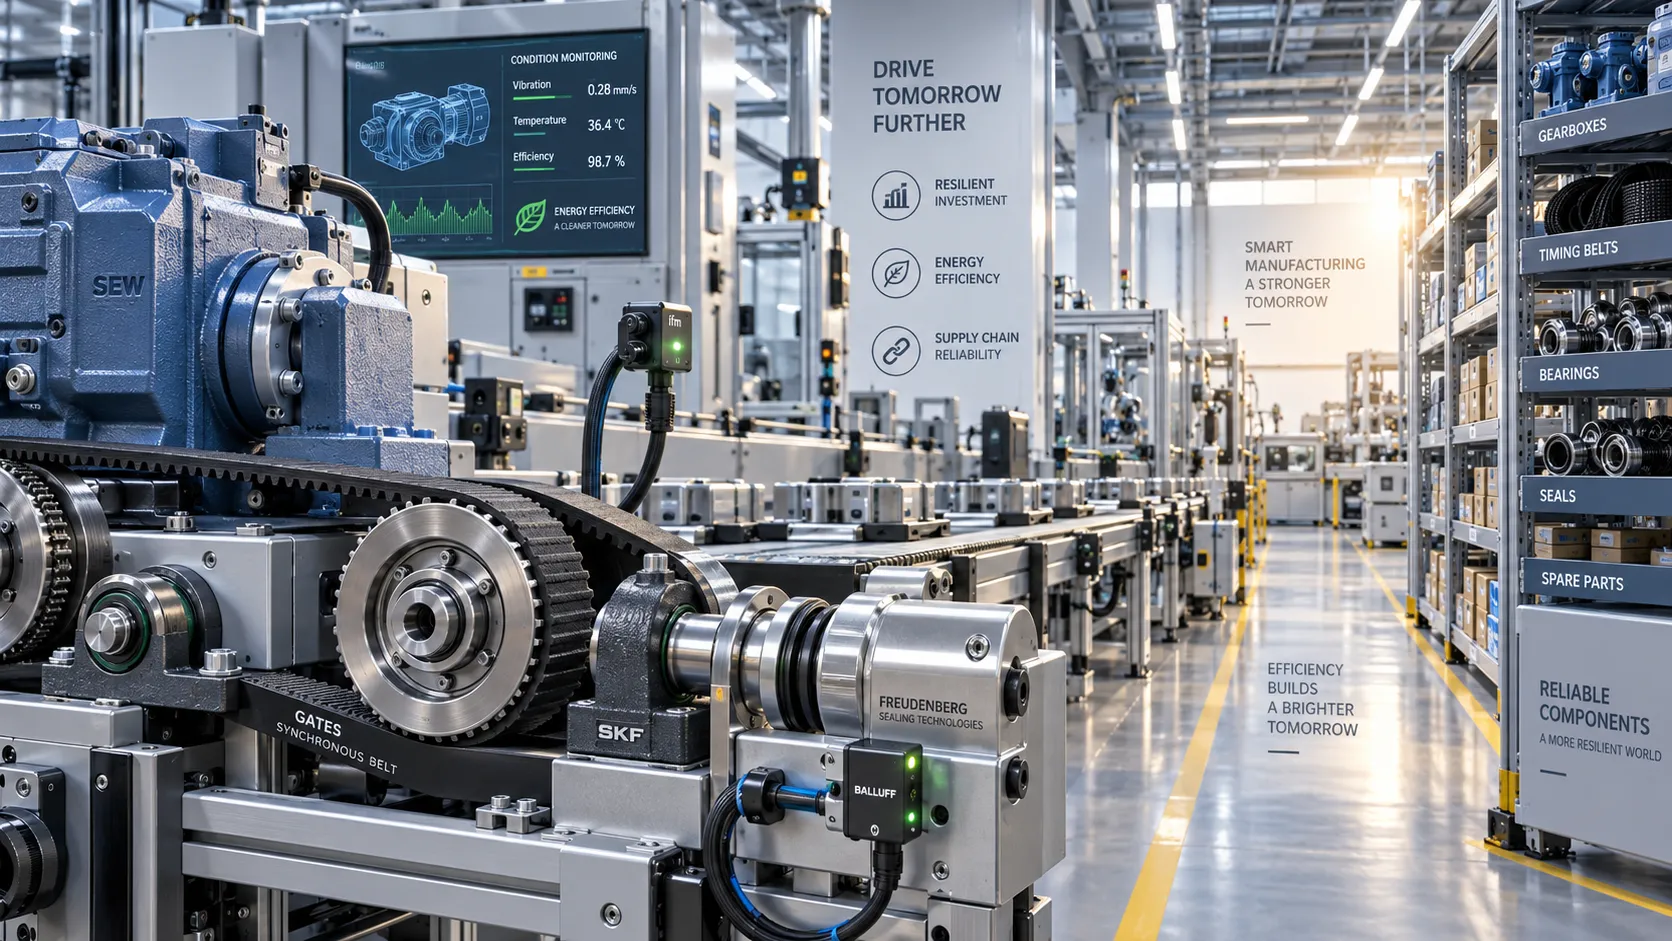
Industrial Economy Trends Shaping Capital Investment and Supply Chain Risk in 2026
Industrial economy trends for 2026 reveal how resilient capital investments, energy efficiency, and supply-chain strategies can protect uptime and strengthen returns.
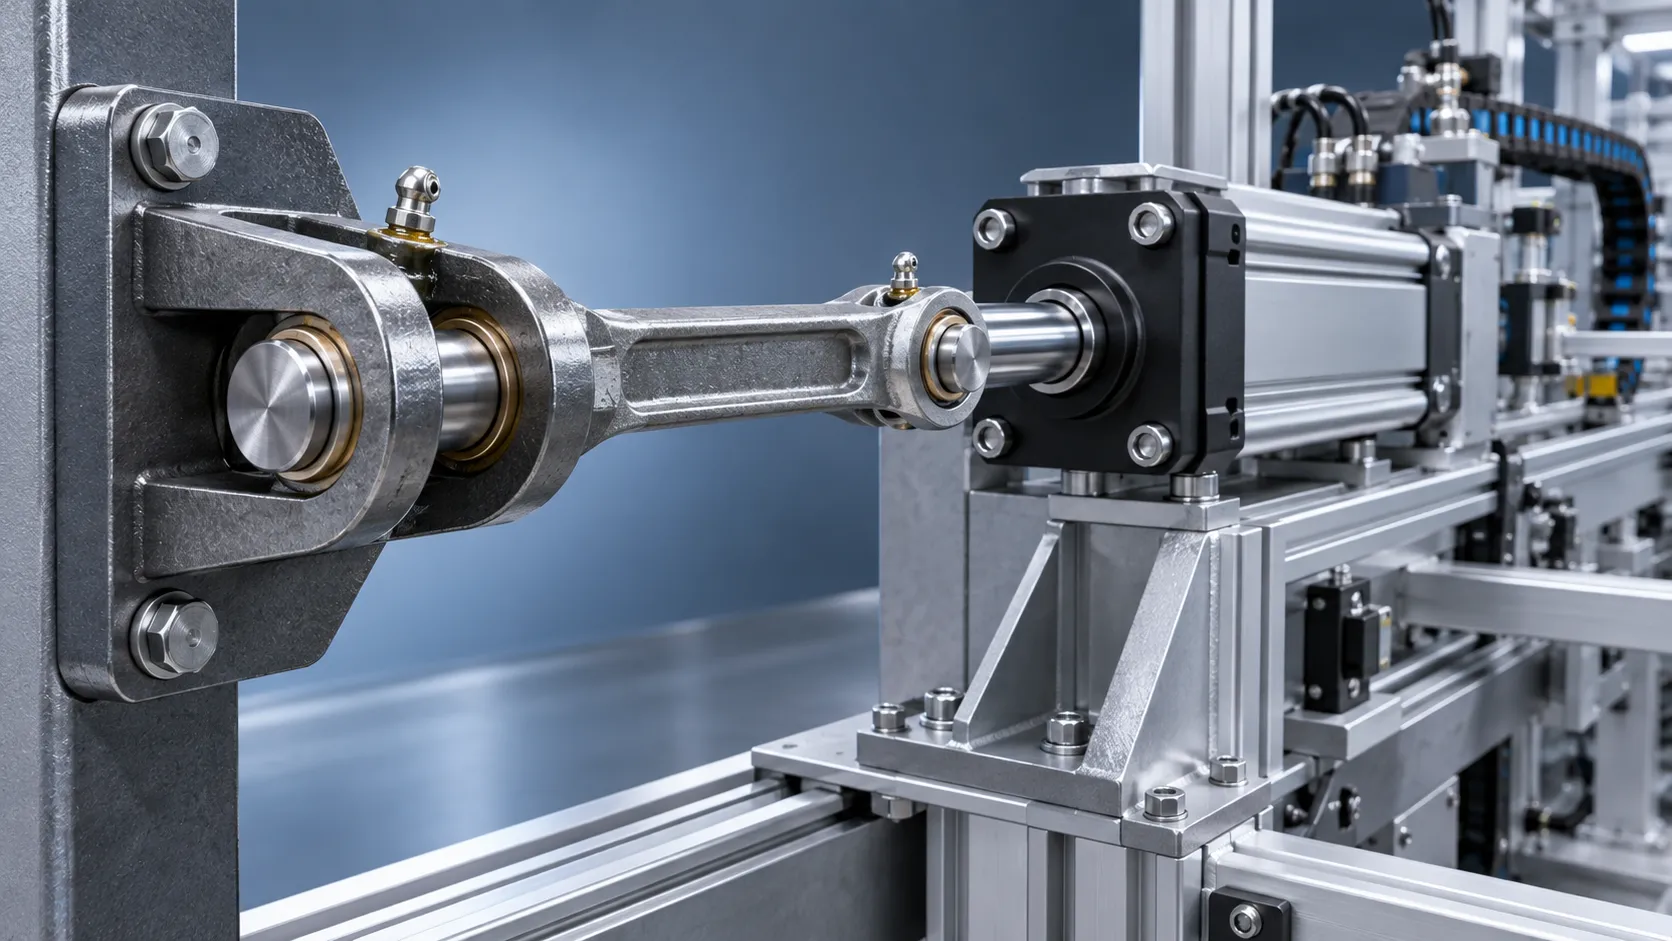
Mechanical Linkage Design: How to Balance Load Capacity, Motion Accuracy, and Wear
Mechanical linkage design guide: balance load capacity, motion accuracy, and wear with practical insights on geometry, joints, tolerances, lubrication, and service life.

How Precision Automated Production Improves Quality Control in High-Volume Assembly
Precision automated production strengthens quality control in high-volume assembly with real-time verification, traceability, and safer defect containment.
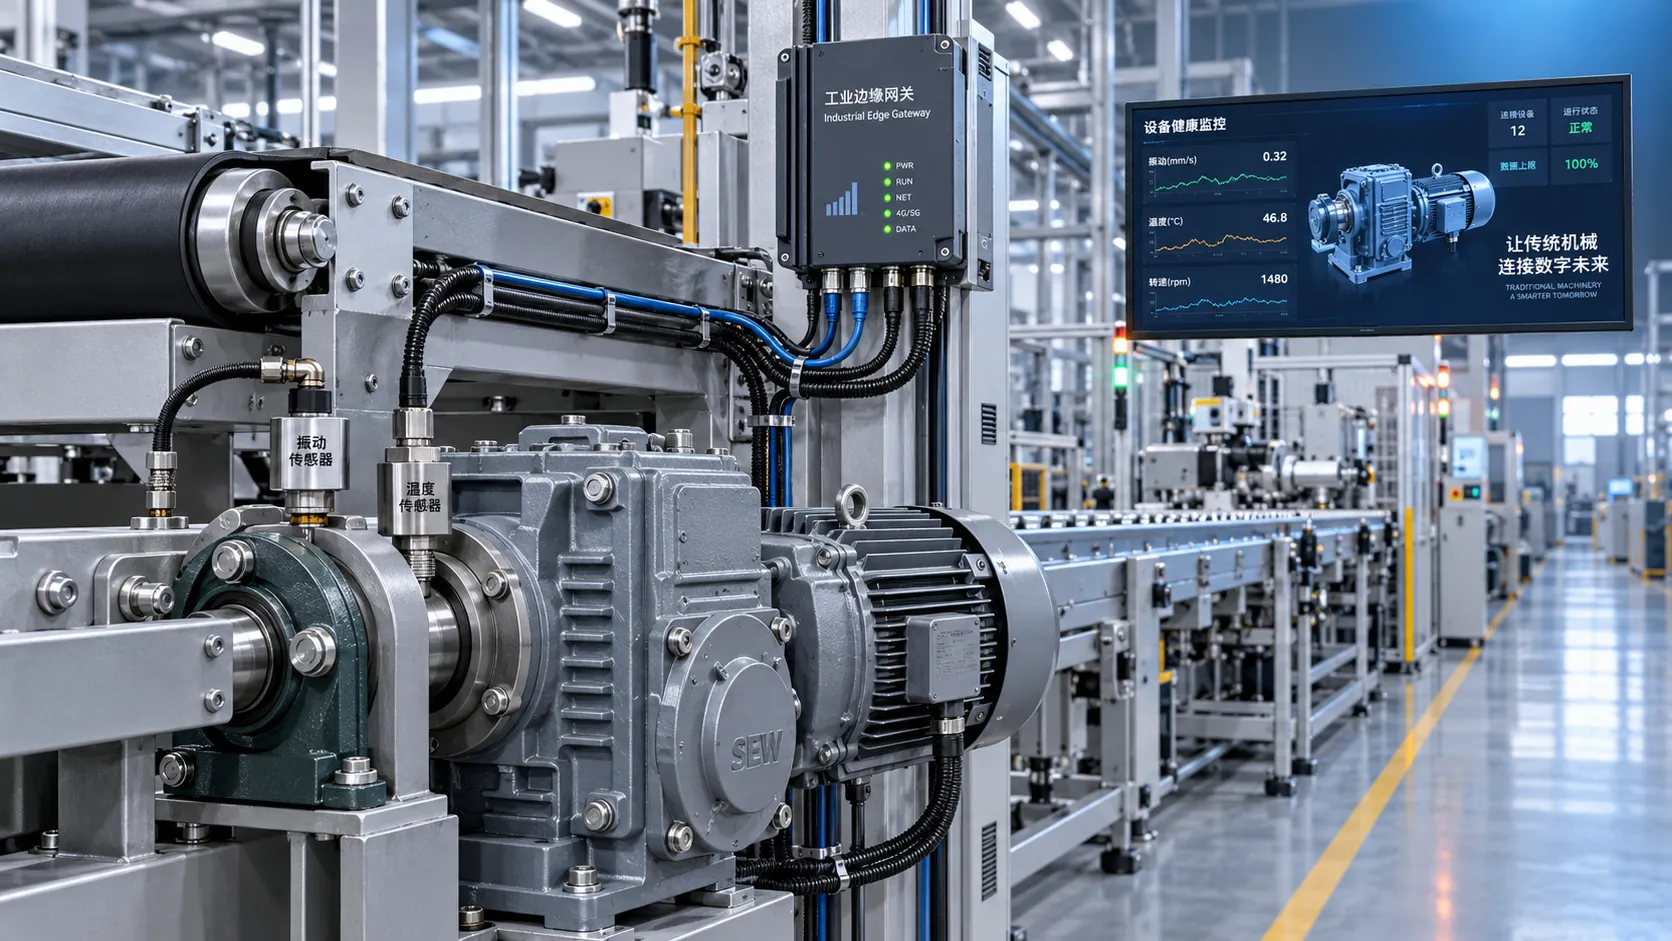
Industry 4.0 Integration: A Roadmap for Connecting Legacy Machines and Data
Industry 4.0 integration roadmap for connecting legacy machines, improving data visibility, reducing downtime, and scaling secure, measurable operational performance.

Servo Drive Comparison: Selecting Motion Control for Speed, Torque, and Load
Technical product comparison servo drives: evaluate speed, torque, inertia, safety, and control integration to select a reliable motion system with proven performance margins.

Industrial Automation Technology: How to Prioritize Upgrades by ROI and Downtime Risk
Industrial automation technology upgrades: learn to rank projects by ROI, bottleneck exposure, and downtime risk to reduce losses and make smarter capital decisions.

Selecting Low-Maintenance Chain Components for Dusty, High-Load Conveyors
Low maintenance chain components for dusty, high-load conveyors: compare seals, lubrication, materials, sprockets, and load capacity to reduce wear and downtime.
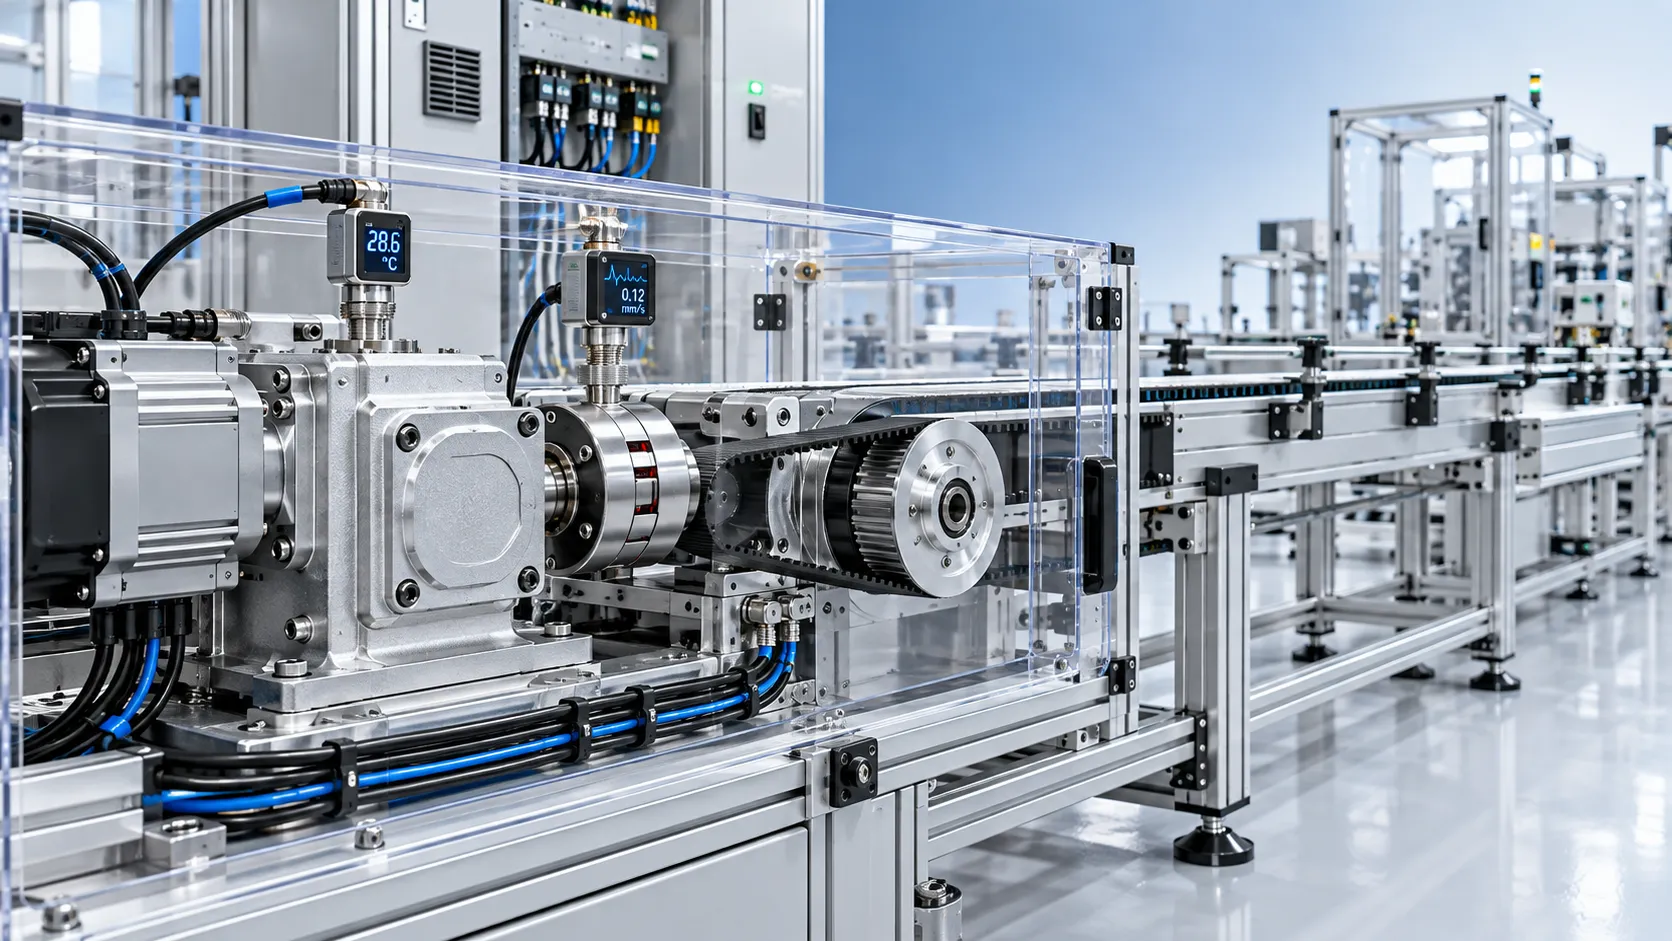
Selecting Smart Transmission Modules for Automated Lines: Control, Load, and Safety
Smart transmission modules for automated lines: evaluate control compatibility, real load demands, safety boundaries, and predictive maintenance value for reliable performance.

How to Assess Automated Packaging Production for High-Mix Manufacturing Lines
Automated production for packaging: assess changeovers, flexibility, controls, reliability, and lifecycle cost to build high-mix lines that deliver stable output.