
Industry News
Curation by industry experts
Hot Articles
Popular Tags
Mechanical efficiency optimization mistakes that raise energy use
Mechanical efficiency optimization can cut energy waste, but many assessment teams overlook hidden design, lubrication, and load-matching errors that quietly increase power consumption. For technical evaluators, understanding these mistakes is essential to judging real system performance, lifecycle cost, and upgrade value. This article highlights where optimization efforts often fail and how to identify practical efficiency gains in complex industrial transmission systems.
In industrial power transmission, small losses accumulate fast. A 2% efficiency drop in a continuously running drive line can become a major operating cost over 8,000 annual hours. For evaluators reviewing motors, reducers, belts, couplings, bearings, and seals, the challenge is not only to identify visible inefficiencies but also to separate theoretical optimization from measurable plant performance.
This matters even more in automated production lines, heavy equipment, and process industries where transmission systems operate under variable loads, temperature swings, contamination, and maintenance constraints. In these settings, mechanical efficiency optimization should be judged as a system issue rather than a single-component upgrade decision.
Where Mechanical Efficiency Optimization Commonly Goes Wrong
Many improvement projects fail because they focus on nameplate efficiency while ignoring interaction losses across the transmission chain. Technical evaluators often see proposals promising lower energy use, yet field results fall short by 3% to 10% because the baseline was incomplete or the operating profile was misunderstood.
Mistake 1: Treating Component Efficiency as System Efficiency
A high-efficiency motor or premium gearbox does not guarantee a high-efficiency system. Losses may occur at belts, couplings, misaligned shafts, overloaded bearings, and seals with excessive drag. If each stage loses only 1% to 3%, a multi-stage arrangement can create a much larger total penalty than expected.
For example, a drive line with motor, coupling, reducer, chain, and driven shaft may appear acceptable when each device is evaluated separately. Yet combined parasitic losses, startup shocks, and partial-load operation can reduce delivered efficiency far more than a catalog review suggests.
What evaluators should verify
- Actual duty cycle over 24 hours, not only rated load conditions
- Number of power transfer stages between motor and driven equipment
- Combined effects of alignment, lubrication, seal friction, and tension setting
- Difference between nominal efficiency and installed operating efficiency
Mistake 2: Ignoring Load Matching and Part-Load Behavior
Oversizing is one of the most frequent sources of hidden energy waste. In many industrial lines, reducers and motors are selected with large safety margins, then run at only 40% to 60% of intended load. That may protect uptime in theory, but it often shifts operation away from the most efficient zone.
Mechanical efficiency optimization must account for torque profile, speed variation, start-stop frequency, and shock loading. A system that looks safe on paper may waste energy if the drive package is too large, belt tension is too high, or the reducer ratio forces the motor into an inefficient operating band.
The table below shows common evaluation gaps that raise energy use even when upgraded components are installed.
The key conclusion is that mechanical efficiency optimization is often defeated by system-level oversights, not by poor component quality alone. Evaluators should audit the entire power path and compare expected savings against measured operating conditions over at least 2 to 4 production weeks.
Mistake 3: Underestimating Friction from Lubrication and Sealing
Tribological losses are easy to underestimate because they develop gradually. A lubricant that is too viscous at startup can increase drag, while one that is too thin at 80°C to 100°C may increase surface contact and wear. In both cases, energy use rises before failure becomes obvious.
Mechanical seals, bearing seals, and contact lip designs also influence efficiency. In dirty environments, teams may specify aggressive sealing for reliability, but if seal drag is not matched to shaft speed, pressure, and lubrication regime, the result can be unnecessary friction and heat generation.
Mistake 4: Assuming Alignment Is a One-Time Installation Task
Shaft alignment, pulley alignment, and base flatness drift over time due to thermal growth, vibration, and structural settlement. Even a small deviation can increase bearing load and shorten component life. In high-duty applications, reassessment every 6 to 12 months may reveal losses that were not present at commissioning.
For evaluators, this means efficiency reviews should include maintenance history, vibration trend data, infrared temperature checks, and evidence of repeated tension adjustment. These signals often indicate that a drive system is consuming extra power to overcome avoidable mechanical resistance.
How Technical Evaluators Can Assess Real Efficiency Gains
A credible evaluation framework should combine mechanical inspection, operating data, and lifecycle economics. In most industrial settings, the target is not the highest laboratory efficiency, but the best stable performance across 3 to 5 years of real production use.
Build a 5-Point Review Model
A practical review model helps distinguish between cosmetic upgrades and genuine mechanical efficiency optimization. Technical teams can use the following five checkpoints before approving replacement, redesign, or procurement.
- Measure actual input power and delivered output under normal load bands.
- Map all loss points from motor shaft to driven equipment.
- Compare sizing assumptions against real torque and speed data.
- Review lubrication, sealing, and alignment history over the last 12 months.
- Estimate savings against maintenance cost, downtime risk, and payback period.
Recommended baseline data
At minimum, collect running current, torque estimate, surface temperature, vibration trend, lubrication interval, and maintenance events. For variable-speed systems, data should cover at least 3 load bands such as below 50%, 50% to 80%, and above 80% capacity.
The table below summarizes decision criteria that help evaluators prioritize projects with the highest probability of measurable savings.
This framework is useful because it connects energy performance to procurement timing and maintenance strategy. An upgrade with a 1-year payback is attractive, but only if alignment, lubrication, and load matching are controlled well enough to preserve the expected gain.
Check the Full Lifecycle Cost, Not Just Input Power
Some proposals reduce measured power draw but increase total ownership cost through shorter service intervals, more expensive consumables, or tighter installation tolerances. Mechanical efficiency optimization should therefore include three cost layers: energy, maintenance, and downtime exposure.
For example, a lower-friction seal design may save energy, yet if it performs poorly in abrasive contamination, unplanned shutdowns can erase the benefit. Likewise, a belt conversion may improve efficiency by a few percentage points but require more frequent retensioning if the application sees repeated shock loads.
Questions evaluators should ask suppliers
- What operating temperature range is assumed for the efficiency claim?
- Is the efficiency figure based on rated load, partial load, or a duty-cycle average?
- How sensitive is the design to misalignment, contamination, or lubrication variation?
- What inspection interval is recommended after installation: 500 hours, 2,000 hours, or 6 months?
- Can the upgrade fit existing shafts, housings, and maintenance routines without rework?
High-Risk Application Scenarios That Distort Efficiency Results
Not every production environment responds to upgrades in the same way. Technical evaluators should pay special attention to applications where load instability, contamination, or thermal variation can mask true system performance and make mechanical efficiency optimization harder to verify.
Variable-Speed Automated Lines
In automated packaging, conveying, and assembly systems, repeated acceleration and deceleration create transient losses that a steady-state audit may miss. A transmission package can appear efficient during a 30-minute test yet perform poorly over a full shift with hundreds of speed changes.
Here, evaluators should compare energy draw across complete production cycles, not only at rated RPM. Monitoring over 3 to 7 days usually gives a more reliable picture of friction rise, belt behavior, and thermal stability.
Heavy Equipment and Shock-Load Duty
Mining, bulk handling, and mobile mechanical systems often use conservative sizing because shock loads can be severe. The risk is that oversized components improve survivability but lock the machine into inefficient operation during normal duty, which may represent 80% of total run time.
A balanced approach is to verify peak torque events separately from average running load. This allows evaluators to determine whether a variable-speed strategy, different ratio selection, or revised coupling design can preserve reliability without carrying continuous energy penalties.
Contaminated or High-Temperature Environments
Dust, water ingress, process chemicals, and temperatures above 60°C can change lubricant behavior and seal drag significantly. In these cases, efficiency claims made under clean laboratory conditions may not hold for more than a short operating window.
Evaluators should ask for application-specific recommendations on seal material, grease type, relubrication interval, and inspection frequency. In many plants, moving from calendar-based maintenance to condition-based review every 1,000 to 2,000 hours yields better control of both energy use and reliability.
Practical Steps to Improve Mechanical Efficiency Optimization Outcomes
The most successful projects combine better engineering assumptions with disciplined execution. For technical evaluators, the goal is to create a repeatable method that identifies wasted power early and prevents optimistic savings estimates from entering capital decisions.
Use a staged implementation approach
A 3-stage approach is usually more reliable than a full replacement decision made from limited data. Stage 1 is baseline measurement. Stage 2 is corrective action on alignment, lubrication, and tension. Stage 3 is component upgrade only after controllable losses have been addressed.
This sequence prevents teams from paying for premium components while leaving low-cost performance problems unresolved. In many plants, basic corrections deliver immediate gains before any major procurement is required.
A disciplined site checklist
- Confirm actual load profile over at least 1 representative production week
- Inspect alignment, tension, vibration, and thermal signatures
- Review lubricant grade, contamination control, and relube interval
- Identify unnecessary stages, idlers, or drag-inducing seals
- Calculate payback using realistic annual operating hours
- Recheck performance 30 to 90 days after implementation
Why intelligence-led evaluation improves decisions
For B2B buyers and technical assessment teams, quality decisions depend on more than product literature. They require linked insight on materials, tribology, transmission architecture, maintenance practices, and sector trends such as energy price volatility and longer uptime expectations.
That is why platforms focused on industrial power transmission and critical mechanical components bring value beyond sourcing alone. Intelligence on drive belts, gear reducers, couplings, seals, and service-life trends helps evaluators compare upgrade options with greater confidence and less procurement risk.
Mechanical efficiency optimization only delivers durable results when system losses are measured honestly, load conditions are matched correctly, and friction sources are managed over time. For technical evaluators, the real opportunity is not chasing theoretical peak efficiency, but identifying practical gains that reduce energy use, stabilize maintenance intervals, and improve lifecycle value across the full transmission chain.
GPT-Matrix supports this decision process with focused intelligence on industrial power transmission, motion control, and critical sealing technologies, helping teams evaluate components and system upgrades through a more connected technical and commercial lens. To review application-specific options, compare transmission strategies, or explore tailored efficiency improvement paths, contact us today to get a customized solution and learn more about the right approach for your operating conditions.
- power transmission
- mechanical components
- motion control
- sealing technologies
- industrial transmission
- mechanical seals
- drive belts
- gear reducers
- tribology
- mechanical efficiency
- heavy equipment
- automated production
- industrial power transmission
- critical sealing
- transmission chain
- automated production lines
- mechanical efficiency optimization
Recommended News
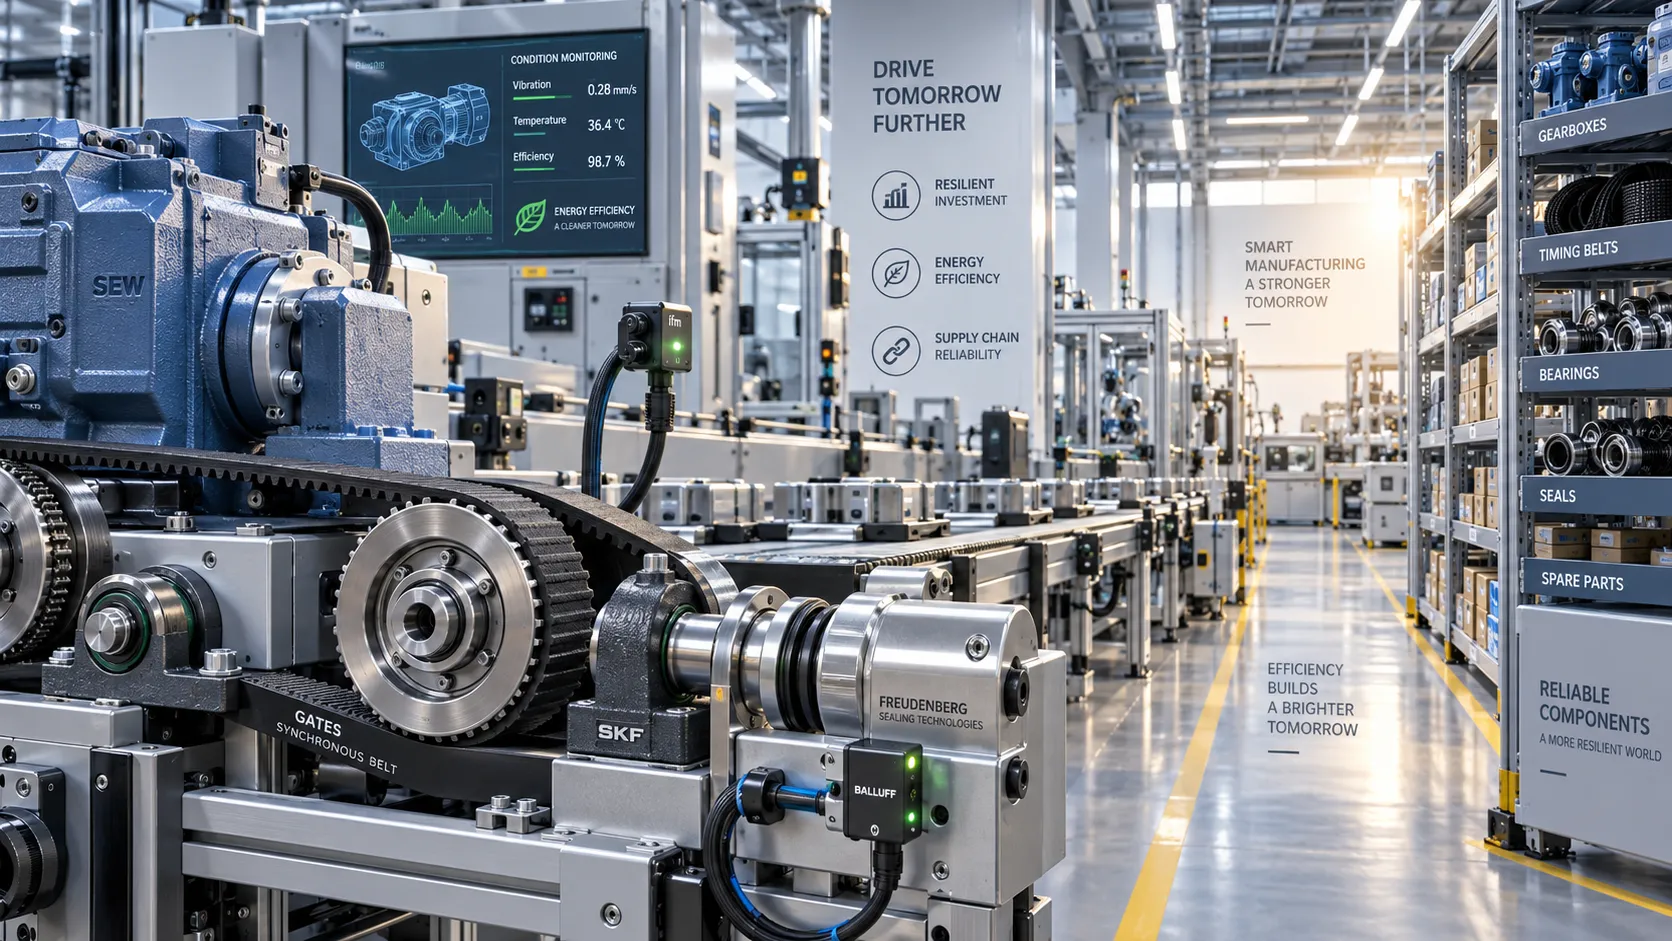
Industrial Economy Trends Shaping Capital Investment and Supply Chain Risk in 2026
Industrial economy trends for 2026 reveal how resilient capital investments, energy efficiency, and supply-chain strategies can protect uptime and strengthen returns.
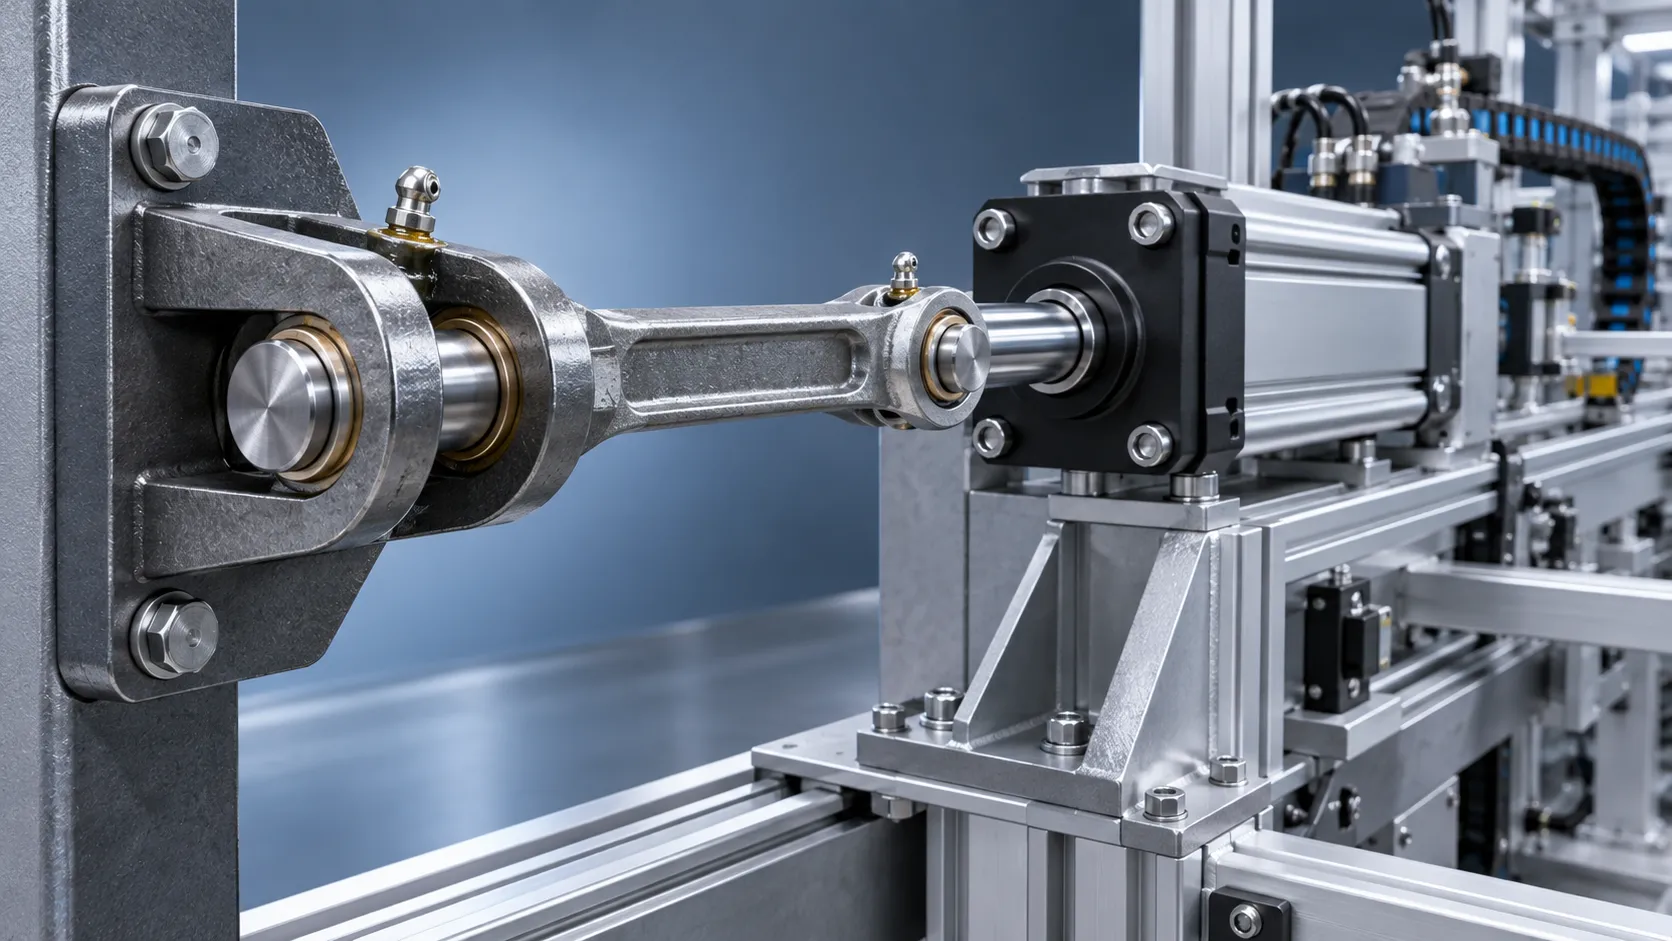
Mechanical Linkage Design: How to Balance Load Capacity, Motion Accuracy, and Wear
Mechanical linkage design guide: balance load capacity, motion accuracy, and wear with practical insights on geometry, joints, tolerances, lubrication, and service life.
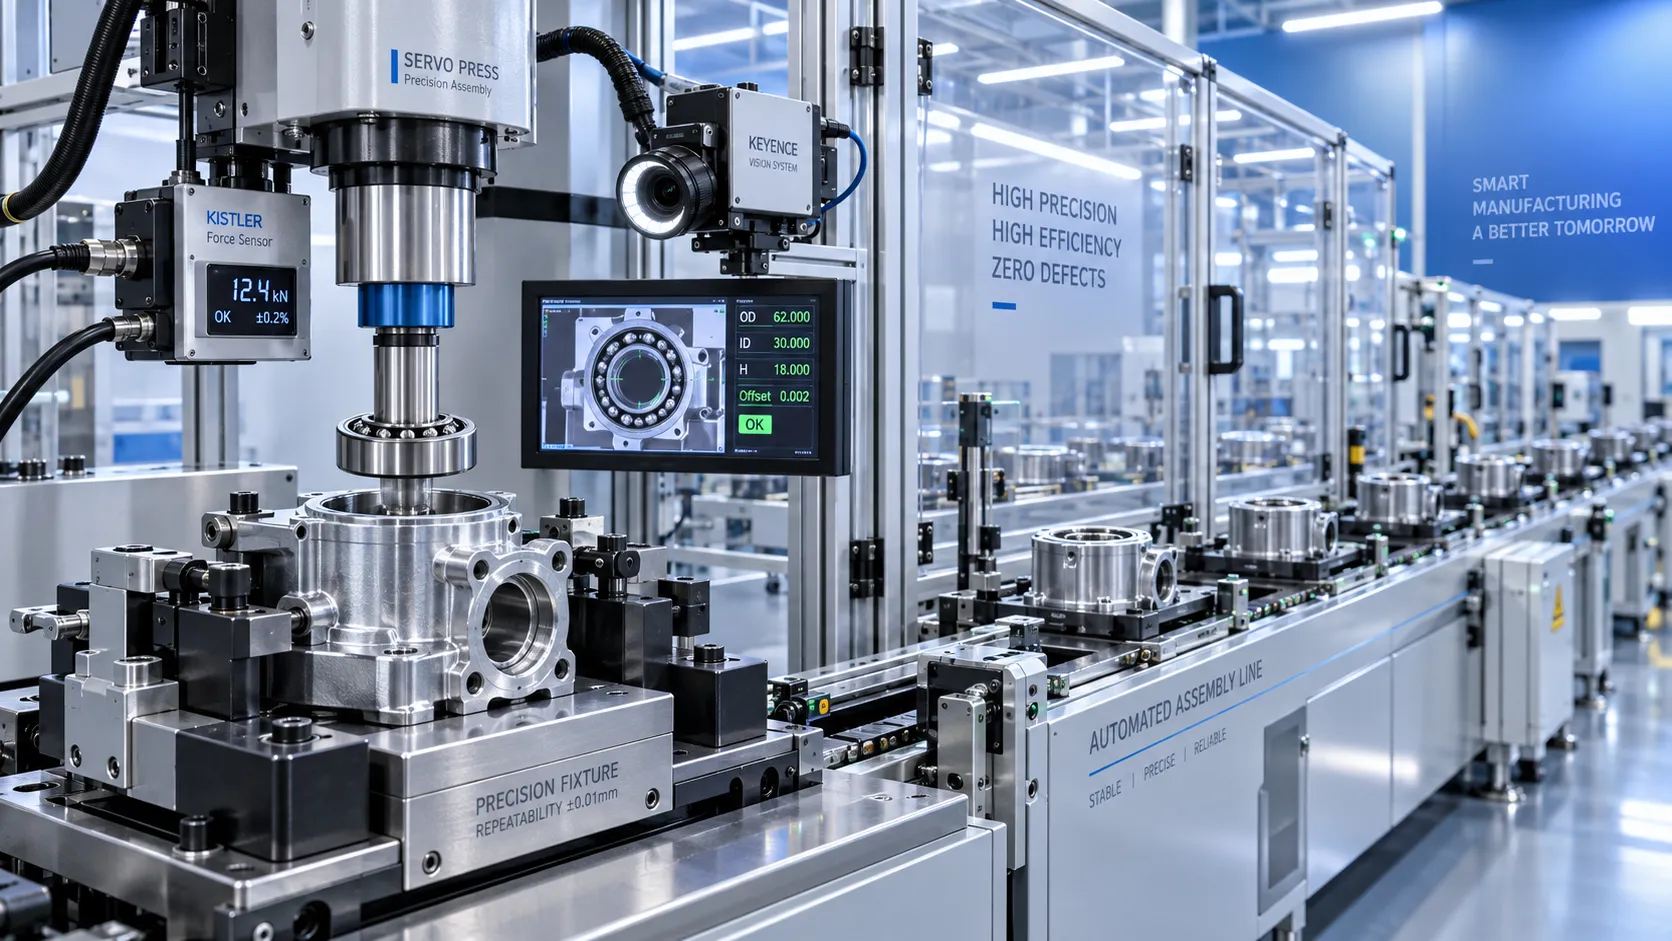
How Precision Automated Production Improves Quality Control in High-Volume Assembly
Precision automated production strengthens quality control in high-volume assembly with real-time verification, traceability, and safer defect containment.
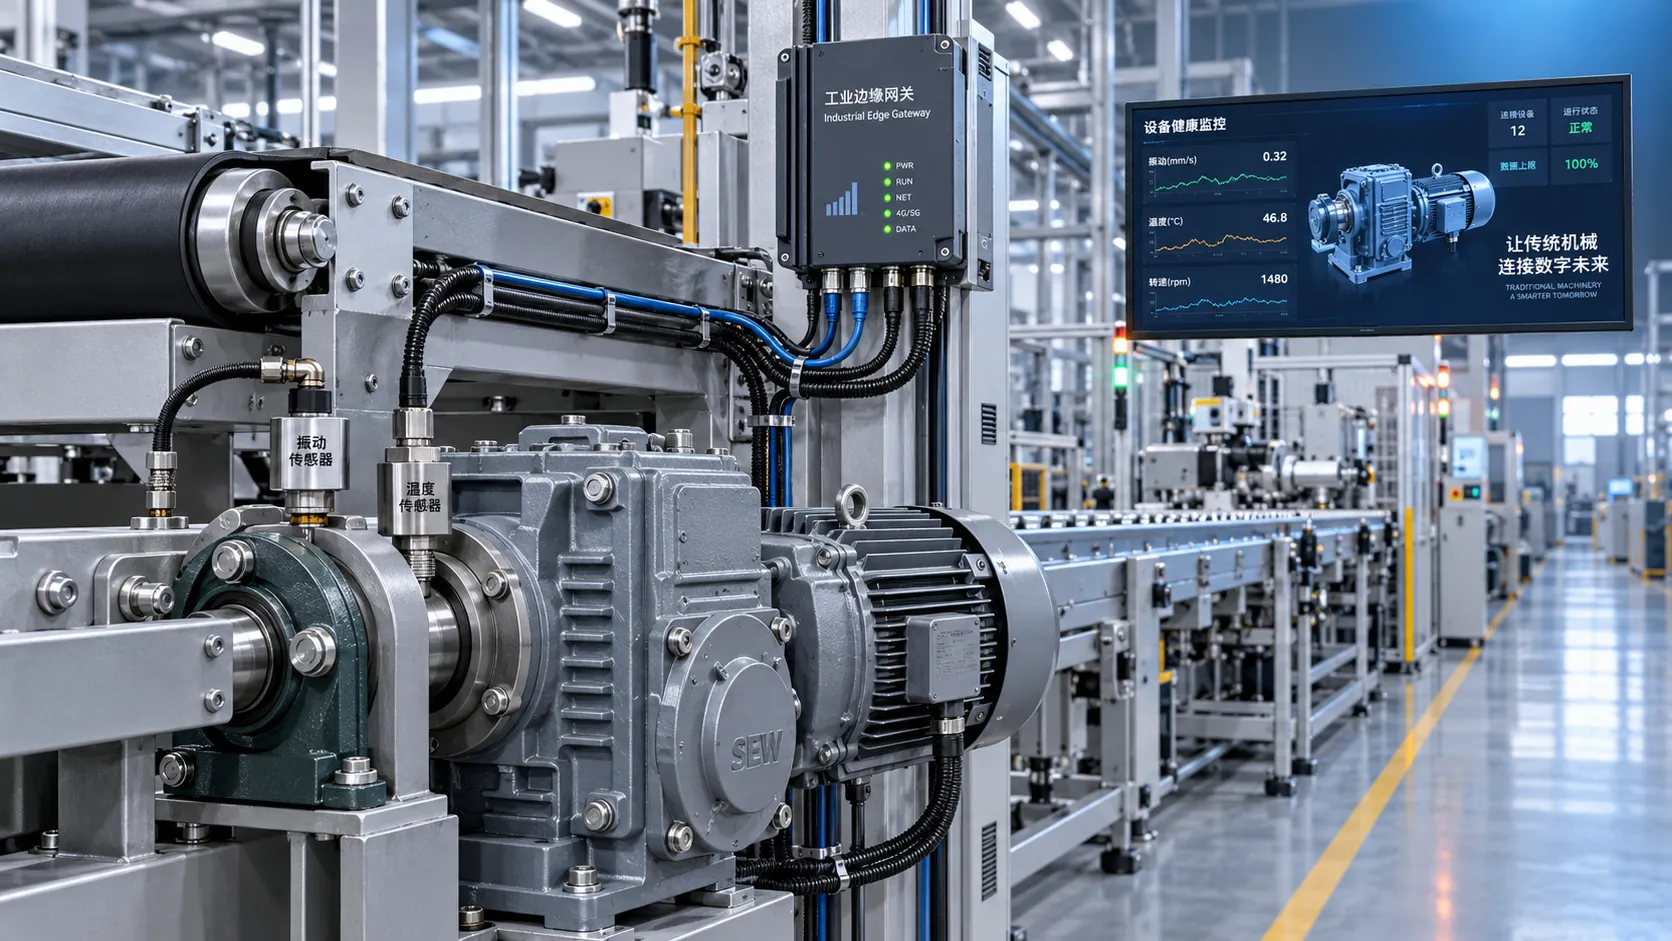
Industry 4.0 Integration: A Roadmap for Connecting Legacy Machines and Data
Industry 4.0 integration roadmap for connecting legacy machines, improving data visibility, reducing downtime, and scaling secure, measurable operational performance.
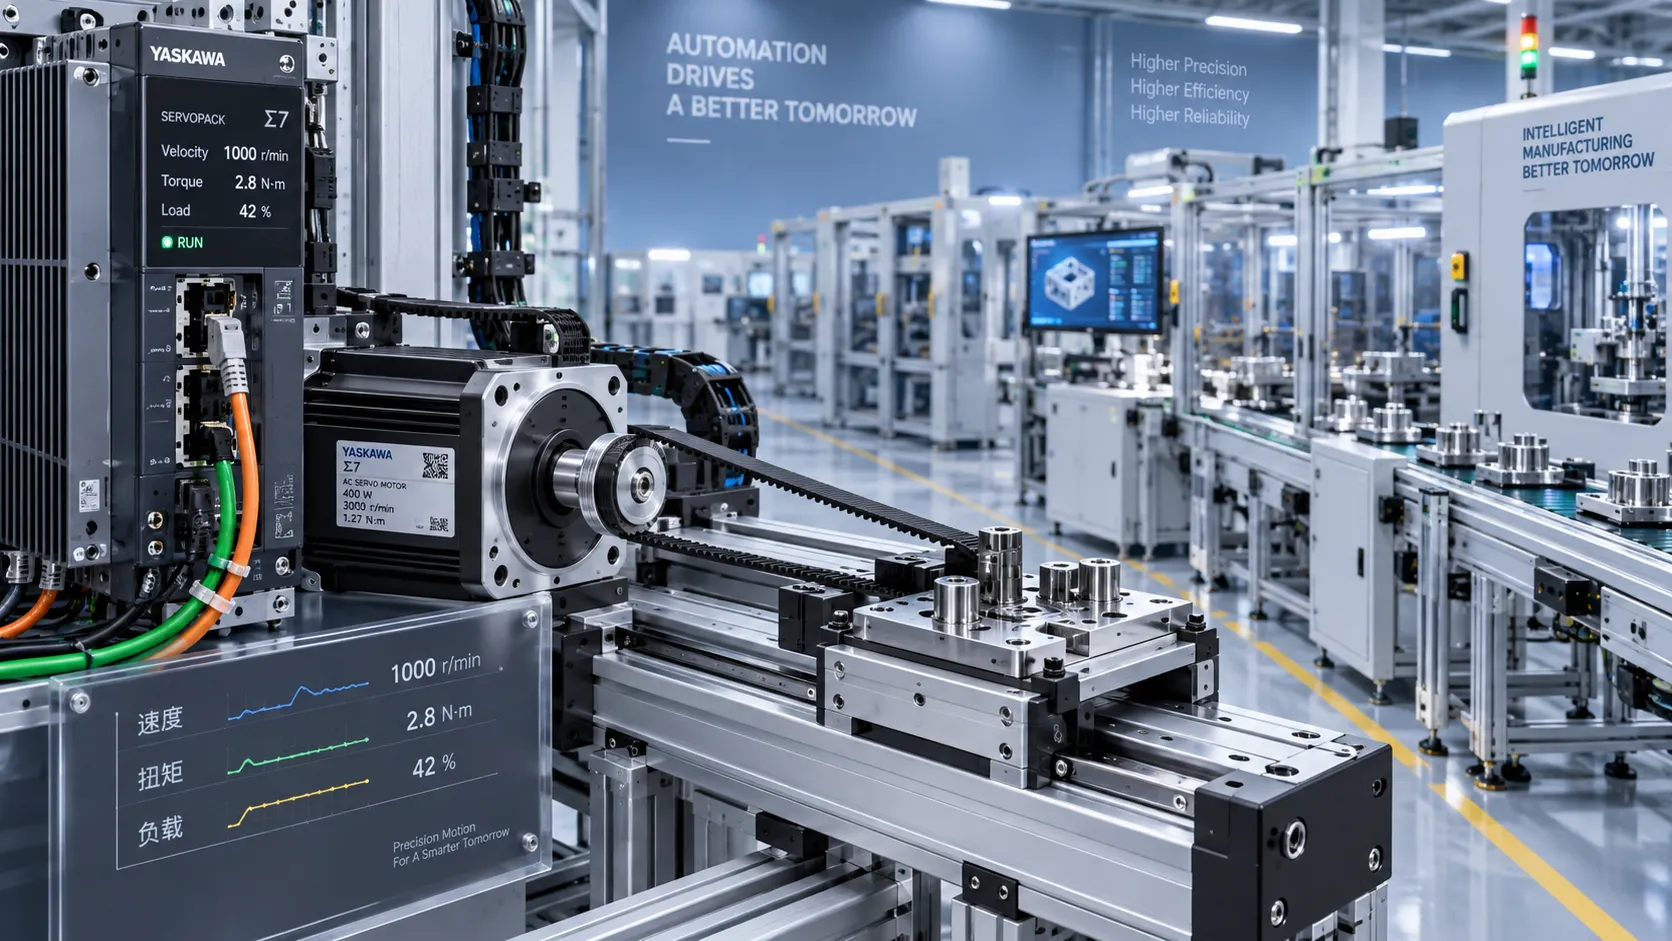
Servo Drive Comparison: Selecting Motion Control for Speed, Torque, and Load
Technical product comparison servo drives: evaluate speed, torque, inertia, safety, and control integration to select a reliable motion system with proven performance margins.

Industrial Automation Technology: How to Prioritize Upgrades by ROI and Downtime Risk
Industrial automation technology upgrades: learn to rank projects by ROI, bottleneck exposure, and downtime risk to reduce losses and make smarter capital decisions.

Selecting Low-Maintenance Chain Components for Dusty, High-Load Conveyors
Low maintenance chain components for dusty, high-load conveyors: compare seals, lubrication, materials, sprockets, and load capacity to reduce wear and downtime.
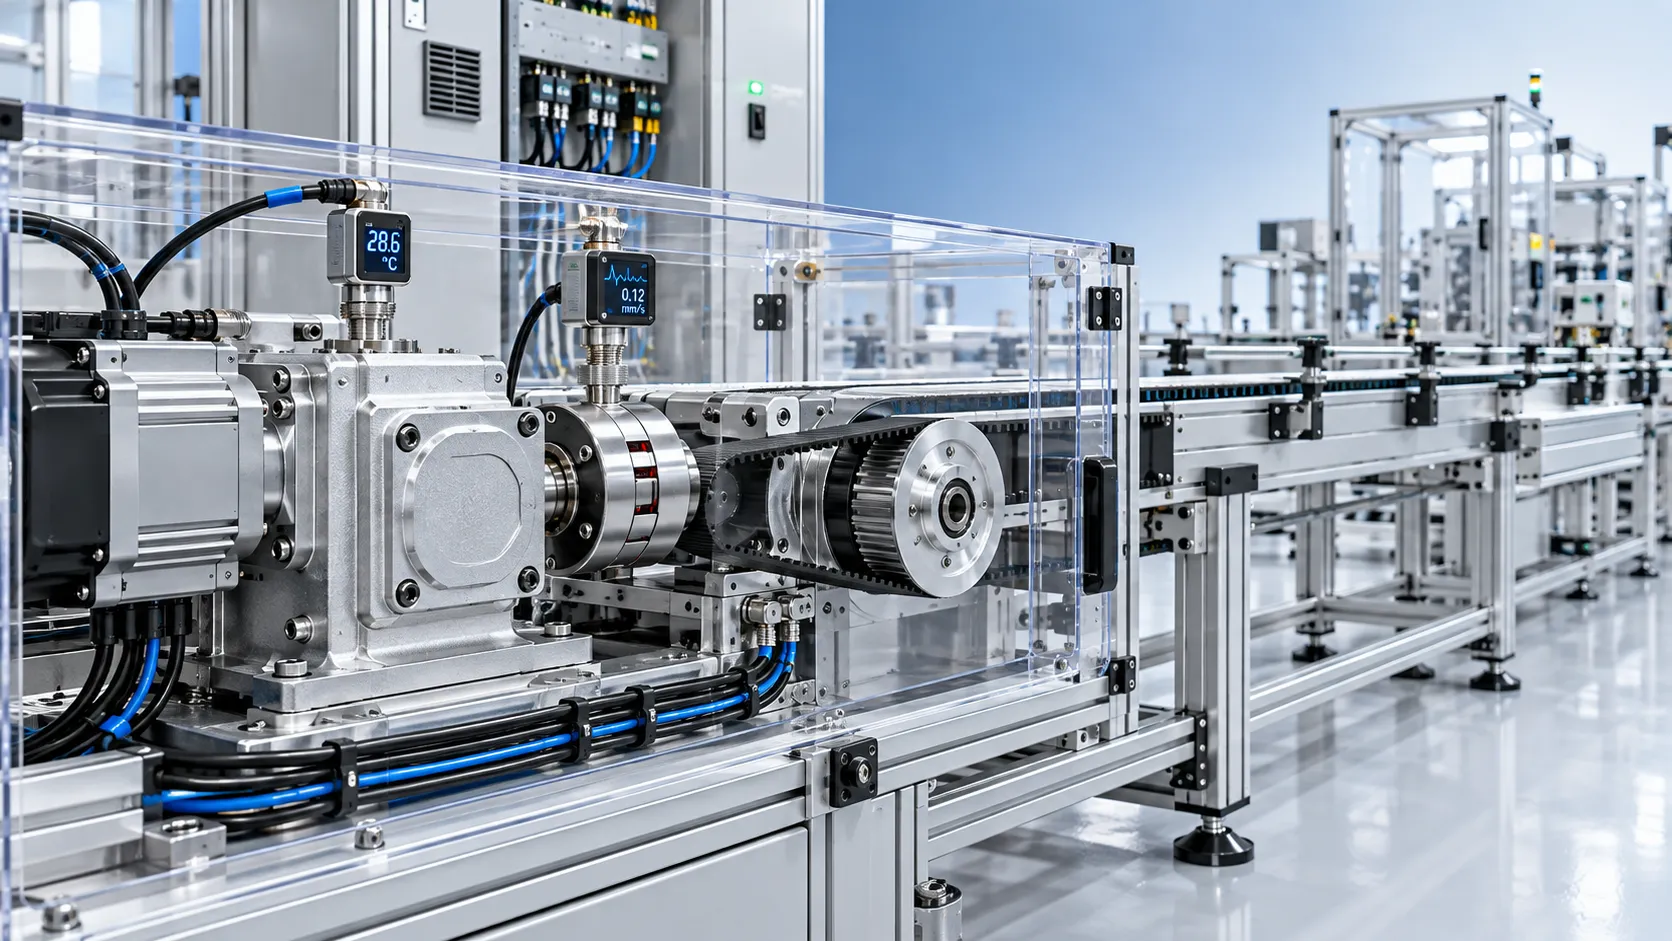
Selecting Smart Transmission Modules for Automated Lines: Control, Load, and Safety
Smart transmission modules for automated lines: evaluate control compatibility, real load demands, safety boundaries, and predictive maintenance value for reliable performance.

How to Assess Automated Packaging Production for High-Mix Manufacturing Lines
Automated production for packaging: assess changeovers, flexibility, controls, reliability, and lifecycle cost to build high-mix lines that deliver stable output.